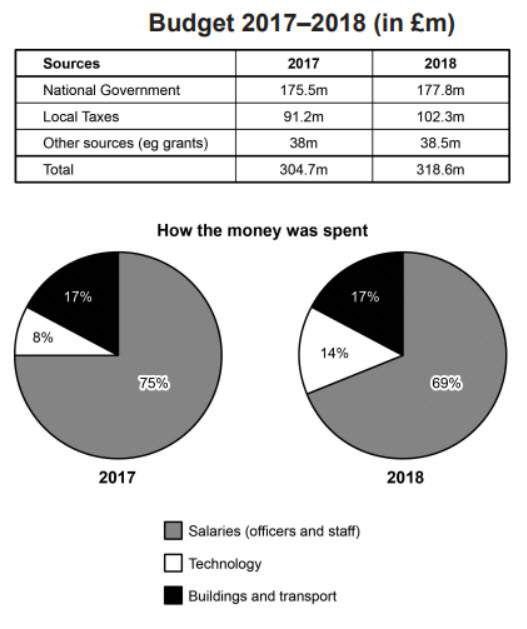
The table and charts detailed below give information about the police budget in 2017 and 2018 in on area of Britain.
Word Count: 0
Submitting...
37 thoughts on “WT 1- 11 Oct, Batch-142”
Fahim Ahmed
The table chart compares data about how much budget was estimated for police, while the pie charts illustrate information about money sending for police on different purposes between 2017 and 2018.
Overall, the highest amount of budget came from national government, whereas other sources contributes least. However, spending money on buildings and transport was equal in both years.
In terms of Budget, national government contributed 175.5 million pounds, which was the highest, the amount increased by approximately 2 million in the next year. Budget came from local taxes and other sources was 91.2 million pounds and 38 million pounds in 2017 and 102.3 million pounds and 38.8 million pounds in 2018 respectively.
On the other hand, money spent on technology was 8%, which witnessed a noticeable rise to 14% on 2018. Although spending money on salaries was highest compared to other sectors initially at 75%, but it decreased minimally to 69% in the next year. Interestingly, there was an equal expenditure on building and transport at 17% in both years.
was equal > Tense
other sources was 91.2 million pounds> SS
money spent on technology was 8%> SM
highest> Article missing
Although spending money on salaries was highest compared to other sectors initially at 75%, but it decreased minimally to 69% in the next year.>SS
The table and charts illustrate the amount of police allocated money of a Britain area in 2017 and 2018.
Overall, the table shows a information about police allocated money for different sectors in a Britain area. the sources of budget had National Government which was the highest, and also Local Texas increased sharply in the year of period. while, the money was spend technology, officers and staff was the lowest.
However, the Government was highest proportion of the sources of of budget at 175.5m, in 2017. the next year reaches noticeably to177.8m, which was a huge difference. Local Texas also increased sharply 91.2m, to 102.3m
The table and charts illustrate the amount of police allocated money of a Britain area in 2017 and 2018. > illegible
. the sources of budget had National Government which was the highest> Cap, SM
while, the money was spend technology, officers and staff was the lowest.> sm
the Government was highest proportion of the sources of of budget at 175.5m, in 2017.> SM , unclear
the next year reaches noticeably to177.8m, which was a huge difference. Local Texas also increased sharply 91.2m, to 102.3m > SM
The table chart compares data about police budget in Britain from 2017 to 2018, while the pie chart illustrates information about the money spent 3 various sectors.
Overall, The table was the highest Local Taxes, and the pie chart was the lowest percentage is Technology.
It is clear that National Government was budget in 2017, at 175.5m, while in 2018, in is gradually increased, at 177.8m. Moreover, in 2017, the Local Taxes was 91.2m, which next year it dramatically rise, at 102.3m. On the other hand, Other sources was 38m in 2017, while in 2018, it increased just 0.5. However, in total budget in 2017, at 304.7m, then in 2018, it rise minimally, at 318.6m.
In addition, in 2017, the highest money spent in Salaries, at 75%, while in 2018, it decreased 6%. However, the Technology was spent the lowest money in 2017, at 8%, however next year it minimal rise, at 14%. Furthermore, Buildings and transport, was spent 17% money in 2017, whereas in 2018, it is unchanged.
spent 3 various> preposition missing
Overall, The table was the highest Local Taxes, and the pie chart was the lowest percentage is Technology.> SM , Poor overview
t is clear that National Government was budget in 2017, at 175.5m, while in 2018, in is gradually increased.> SM
dramatically rise> word collocation
it increased just 0.5. > Pre missing
rise> Rose
Buildings and transport, was spent 17% money in 2017> SM
The table chart compares data about police budget of Britain, whereas, the pie chart illustrates information about spending money in three different categories, from 2017 to 2018.
overall, the largest proportion of police budget on national government in both years. Furthmore, the percentage of buildings and transport it can be seen that are equals in two years.
in terms of police budget, national government particularly had been not so far from each years which was 175.5m and 177.8m. however, the local texes was the low in 2017 and then it was significantly grew up which accounted 102.3m in the year 2018. in addition ,
Paragraphing missing
whereas,> Punctuation
, the largest proportion of police budget on national government in both years. >SM
in terms of police budget, national government particularly had been not so far from each years which was 175.5m and 177.8m> Cap and Sentence making
in addition , > Incomplete
The table chart illustrate about the budget in 2017 and 2018. On the other hand, the pie chart inform about money spent.
Overall, the total budget rate had increase and the other sources rate was similar in between year. However, salaries are decrease and buildings and transport was also similar in two year.
In terms, national government was highest rate in 2017 but it decrease almost 2 million pound in the next year. Also the local taxes are increase in 2028 in 102.3 million pound. Which, 91.2 million pound in 2017. However other other sources almost similar in two year in 2017 and 2018 in 38 million pound and 38.5 million pound respectively.
In 2017 salaries was highest rate in 75% but it decrease less than 6% in 2018. Buildings and transport also same in between year. Whereas, the technology was 8% in 2017 and it increase in 2018 in 14%.
No paragraphing at all
illustrate > WF
inform> WF
the total budget rate had increase and the other sources rate was similar in between year> SM
terms, > Cap
salaries are decrease and buildings and transport was also similar in two year. > SM
2017 salaries > Punc
it increase in 2018 in 14%.> SM
The table compares data about the police budget on area of Britain in year 2017 and 2018.whereas, the pie charts depticts information about spending money in three different categories at same year.
Overall, the highest proportion of police budget noticed in source of national government, while other sources(eg grants) pretended lowest portion. Furthermore, in pie chart buildings and transport sectors percentage was equal in both years.
In terms of police budget, national government particularly had been not so far from each other, which was 175.5m in 2017 and 177.8m in 2018. Local taxes percentage was low(91.2m) in 2017 from 2018,it was 102.3m.Afterwards, other sources(eg grants) had lowest budget in this table, where ratio had 38m and 38.5m in both year.
In money spent, there are 3 individuals sectors, where highest amount is in salaries, which is 75% and 69% respectively.however, there
2018.whereas> Cap or Punc
lowest>Article
Local taxes percentage was low(91.2m) in 2017 from 2018,it was 102.3m> SM
where ratio had 38m and 38.5m in both year.> SM
n money spent, there are 3 individuals sectors, where highest amount is in salaries, which is 75% and 69% respectively.however, there > Unclear and sm
The table and charts detailed below give data about the police ailocated money in the year 2017 and 2018 on area The Britain.
overall, in the table budget 2017-2018 in sources most highest in the national government in 2017 year 175.5 m and very lowest in 2017 38 m other sources (eg grants). The charts detailed was the money spent in 2017 and 2018. In the 2017 highest salaries 75% and lowest technology 8% in the year 2017.
In items the table budget in 2017-2018 the sources. Other sources (eg grants) most similar in 2017 38 m and 38.5 m in 2018.Local taxes sources 91.2 m in 2017, but it is developed in 2018. The table all items sources in total 304.7 m in 2017 and 318.6 m in 2018.
Secondly, The charts was the money spent in the two years in 2017-2018.
The table and charts detailed below give data about the police ailocated money in the year 2017 and 2018 on area The Britain.> SM and SP
overall > Cap
verall, in the table budget 2017-2018 in sources most highest in the national government in 2017 year 175.5 m and very lowest in 2017 38 m other sources (eg grants). The charts detailed was the money spent in 2017 and 2018. In the 2017 highest salaries 75% and lowest technology 8% in the year 2017. > Unclear overview
In items the table budget in 2017-2018 the sources> SM
The table chart illustrates about the police budget and the sources of money in 2017 and 2018, while the pie charts compare between 2017 and 2018 how the police spent the money in Britain.
Overall, in pie charts ,the figures showed that the money was spent more on salaries ( officers and staff) and it was higher in percentage than other remaining sector. In table chart, the total budget of the police was similar in both years.
In terms of sources, from the national government highest amount of money was added to the budget, at about 175.5m and 277.8m,in both respective year. Local taxes were second on the list in 2017 and 2018, which was 91.2m and 102.3m. At last, others sources also contributed almost same amount of money in both year, at about 38m.
In concern of 2017, in salaries most percentage of money was spent, at 75%, whereas in technology, and buildings & transportation it was 8% and 17% respectively. Likewise , in salaries highest number of money was spent, at 69% in 2018. And other both sector was quite l
sector, year> WF
the total budget of the police was similar in both years.> SM
from the national government highest amount of money was added to the budget, > Unclear
Local taxes were second on the list in 2017 and 2018, which was 91.2m and 102.3m.> SS
most percentage of money was spent,> SM
it was > Tense
The table illustrate about the budget in 2017- 2018.On the other hand the pie chart inform about money spent.
Overall, the national had government had increase the other sources. rate was smiler in between in this yea .However selaeries are decrease and buildings and transport was also similar in two year.
In terms, national government was highest rate 2017 but it decrease 2% in this the next year. The taxes are increase in 2008 in 102.3m.In 2018 in 102.3 m pound. Which 91.2 million pound 2017.
However the other sources almost sources most same, in two years 2017 and 2018 in 38 million pounds respectively.
In 2017 saleries highest rate 75 but it decrease less than 6% 2018. Transport and buildings also same between years. The technology was 8% it increase 2018 in 4%.The other side of the officers staff in 2017 was 75%.
illustrate> WF
2018.On > Space
the national had government had increase the other sources. rate was smiler in between in this yea > SM , Unclear
However selaeries are decrease and buildings and transport was also similar in two year. > SP and SM
terms, national > Punctuation
national government was highest rate 2017 but it decrease 2% in this the next year. > SM
The taxes are increase in 2008 in 102.3m.In 2018 in 102.3 m pound. Which 91.2 million pound 2017. > SM
However > Punctuation
In 2017 saleries highest rate 75 but it decrease less than 6% 2018. Transport and buildings also same between years. The technology was 8% it increase 2018 in 4%.The other side of the officers staff in 2017 was 75%. > SM, Unclear
The table chart illustrates information about the police allocated money of Britain, in the year of 2017 and 2018.
Overall, There are 3 sectors of budget firstly National Government, Secondly local axes, and lastly other sources (eg grants). Police earn there highest budget from National Government. and lowest budget from other sources(eg grants).
However, the government was highest amount of the sources of budget. In the year of 2017 National Government gave the police 175.5m Pound, and the next year national government gave the police 177.8m Pound. The highest amount of the money in the year of 2018. In 2017 local taxes are 91.2m Pound and 2018 local taxes are 102.3m Pound we saw that 2018 are local taxes increased sharply.
In concern of 2018 is one of the big budget year and 2017 are lowest from 2018.
The table illustrates about the of the budget 2017- 2018 in the money spent in england.
overall, the highest was 2017 is national government are 175.5m. and the lowest was other sources is 38m. IN the pie 2017, salaries 75% in other salaries for staff and officers. in the year 2018, was decrease 69 less than
In terms, the budget was in national government was 175.5m and the 2018 was 177.8m. In local taxes was 2017 is 91.2m. and 2018 it is increase more than 11%. and other resources was 38m just little 38.5m.
on the other side, The salaries of the officers and staff in 2017 was 75%. It is the highest salary in this year. In transportation and buildings, was 17%. and the technology was 8%. In 2018 , salaries was 69% and technology was 14% and buildings was 17%. it is the same was buildings both the year.
The table illustrates about the of the budget 2017- 2018 in the money spent in england. > SM
l, the highest was 2017 is national government are 175.5m. and the lowest was other sources is 38m. IN the pie 2017, salaries 75% in other salaries for staff and officers. in the year 2018, was decrease 69 less than > Poor overview and SM
terms, the budget> Cap
In local taxes was 2017 is 91.2m. and 2018 it is increase more than 11%. and other resources was 38m just little 38.5m. > SM
, The salaries > Cap> on the
. it is the same was buildings both the year. > SM
The table chart illustrates information about the police budget in the years 2017 and 2018 in on area of Britain, while the pie chart chart information about the money was spent in 3 different sector.
Overall, the largest budget was National Government in 2017, while the least budget was Others sources in 2018. Both of the years highest money was spent in Salaries compares others sector.
In terms of 2017, National Government had the highest budget comapres others sector, which was 175.5m, but 2018 this figure had the slighty increase and reached 177.8m. However, Both country had the almost similar budget in Others sources. In contrast, local taxes increse slightly from 91.2m in 2017 to 102.3m in 2018.
On the other hand, the lergest money was spent in Salaries officers and stuff compares others in 2017 and 2018, which was 75% and 69% 2017, however technology had the lowest spent money in 2017, but this figure increse in 2017, which was 8% to 14%, in contrast similar spent money in Buildings and transport which was 17% in both countries.
The table illustrates information about the detalied of police budget during the one year period and the pie charts provide information about spending money by using three catagories in Britian, from 2017 to 2018.
Overall, the most amount of police budget had in 2018 in all categories, while expending money had the lowest fall on technology over the year.
In terms of national government, police budget was 175.5m at the beginning of the poeriod that rose to 177.8m at the ending of the period, which had the largest amount for police cost. Similarly, local taxes, almost 11.3m budget had risen in 2018.Notably that police budget on other sources was almost equal that had accounted for 38.5m.
In contrast, the highest spendimg sector had on salaries for offices and staff in 2017 that declined by 6% in 2018. Converesly, money expense on tecnology rose by 6% over the year, however, disbursing money in building and transport had similar portion that accounted for 17% both 2017 and 2018 respectively.
the most amount of police budget had in 2018 in all categories, while expending money had the lowest fall on technology over the year.> Write separately
, local taxes, almost 11.3m budget had risen in 2018. > SM
2018.Notably > Use space
he highest spendimg sector had on salaries for offices and staff in 2017 > SM
The table and charts depict information about the police budget in one area of Britain in 2017 and 2018,including where the money came from and how it was spent.
Overall,the total police budget increased slightly in 2018 compared to 2017.The main source of income in both years was the national government, while the biggest part of the spending went on salaries.
In 2017,the total budget was 304.7 million pound which rose to 318.6 million pound in 2018.The amount from the national government went up a little form 175.5m to 177.8m. Local taxes also increased notably from 91.2 million pound to 102.3 million pound, while other sources rose only slightly from 38 to 38.5 million pound.
In terms of spending, salaries made up the largest portion in both years,although the percentage dropped from 75% in 2017 to 69% in 2018.The proportion of spending on technology doubled from 8% to 14%, while the figure for buildings and transport remained stable at 17% in both years.
The table chart compares data about how much budget was estimated for police, while the pie charts illustrate information about money sending for police on different purposes between 2017 and 2018.
Overall, the highest amount of budget came from national government, whereas other sources contributes least. However, spending money on buildings and transport was equal in both years.
In terms of Budget, national government contributed 175.5 million pounds, which was the highest, the amount increased by approximately 2 million in the next year. Budget came from local taxes and other sources was 91.2 million pounds and 38 million pounds in 2017 and 102.3 million pounds and 38.8 million pounds in 2018 respectively.
On the other hand, money spent on technology was 8%, which witnessed a noticeable rise to 14% on 2018. Although spending money on salaries was highest compared to other sectors initially at 75%, but it decreased minimally to 69% in the next year. Interestingly, there was an equal expenditure on building and transport at 17% in both years.
was equal > Tense
other sources was 91.2 million pounds> SS
money spent on technology was 8%> SM
highest> Article missing
Although spending money on salaries was highest compared to other sectors initially at 75%, but it decreased minimally to 69% in the next year.>SS
Band : 6.0
The table and charts illustrate the amount of police allocated money of a Britain area in 2017 and 2018.
Overall, the table shows a information about police allocated money for different sectors in a Britain area. the sources of budget had National Government which was the highest, and also Local Texas increased sharply in the year of period. while, the money was spend technology, officers and staff was the lowest.
However, the Government was highest proportion of the sources of of budget at 175.5m, in 2017. the next year reaches noticeably to177.8m, which was a huge difference. Local Texas also increased sharply 91.2m, to 102.3m
The table and charts illustrate the amount of police allocated money of a Britain area in 2017 and 2018. > illegible
. the sources of budget had National Government which was the highest> Cap, SM
while, the money was spend technology, officers and staff was the lowest.> sm
the Government was highest proportion of the sources of of budget at 175.5m, in 2017.> SM , unclear
the next year reaches noticeably to177.8m, which was a huge difference. Local Texas also increased sharply 91.2m, to 102.3m > SM
Band Score > 4.5
The table chart compares data about police budget in Britain from 2017 to 2018, while the pie chart illustrates information about the money spent 3 various sectors.
Overall, The table was the highest Local Taxes, and the pie chart was the lowest percentage is Technology.
It is clear that National Government was budget in 2017, at 175.5m, while in 2018, in is gradually increased, at 177.8m. Moreover, in 2017, the Local Taxes was 91.2m, which next year it dramatically rise, at 102.3m. On the other hand, Other sources was 38m in 2017, while in 2018, it increased just 0.5. However, in total budget in 2017, at 304.7m, then in 2018, it rise minimally, at 318.6m.
In addition, in 2017, the highest money spent in Salaries, at 75%, while in 2018, it decreased 6%. However, the Technology was spent the lowest money in 2017, at 8%, however next year it minimal rise, at 14%. Furthermore, Buildings and transport, was spent 17% money in 2017, whereas in 2018, it is unchanged.
spent 3 various> preposition missing
Overall, The table was the highest Local Taxes, and the pie chart was the lowest percentage is Technology.> SM , Poor overview
t is clear that National Government was budget in 2017, at 175.5m, while in 2018, in is gradually increased.> SM
dramatically rise> word collocation
it increased just 0.5. > Pre missing
rise> Rose
Buildings and transport, was spent 17% money in 2017> SM
Band > 5.5
The table chart compares data about police budget of Britain, whereas, the pie chart illustrates information about spending money in three different categories, from 2017 to 2018.
overall, the largest proportion of police budget on national government in both years. Furthmore, the percentage of buildings and transport it can be seen that are equals in two years.
in terms of police budget, national government particularly had been not so far from each years which was 175.5m and 177.8m. however, the local texes was the low in 2017 and then it was significantly grew up which accounted 102.3m in the year 2018. in addition ,
Paragraphing missing
whereas,> Punctuation
, the largest proportion of police budget on national government in both years. >SM
in terms of police budget, national government particularly had been not so far from each years which was 175.5m and 177.8m> Cap and Sentence making
in addition , > Incomplete
Band score : 4.0
The table chart illustrate about the budget in 2017 and 2018. On the other hand, the pie chart inform about money spent.
Overall, the total budget rate had increase and the other sources rate was similar in between year. However, salaries are decrease and buildings and transport was also similar in two year.
In terms, national government was highest rate in 2017 but it decrease almost 2 million pound in the next year. Also the local taxes are increase in 2028 in 102.3 million pound. Which, 91.2 million pound in 2017. However other other sources almost similar in two year in 2017 and 2018 in 38 million pound and 38.5 million pound respectively.
In 2017 salaries was highest rate in 75% but it decrease less than 6% in 2018. Buildings and transport also same in between year. Whereas, the technology was 8% in 2017 and it increase in 2018 in 14%.
No paragraphing at all
illustrate > WF
inform> WF
the total budget rate had increase and the other sources rate was similar in between year> SM
terms, > Cap
salaries are decrease and buildings and transport was also similar in two year. > SM
2017 salaries > Punc
it increase in 2018 in 14%.> SM
Band : 5.5
The table compares data about the police budget on area of Britain in year 2017 and 2018.whereas, the pie charts depticts information about spending money in three different categories at same year.
Overall, the highest proportion of police budget noticed in source of national government, while other sources(eg grants) pretended lowest portion. Furthermore, in pie chart buildings and transport sectors percentage was equal in both years.
In terms of police budget, national government particularly had been not so far from each other, which was 175.5m in 2017 and 177.8m in 2018. Local taxes percentage was low(91.2m) in 2017 from 2018,it was 102.3m.Afterwards, other sources(eg grants) had lowest budget in this table, where ratio had 38m and 38.5m in both year.
In money spent, there are 3 individuals sectors, where highest amount is in salaries, which is 75% and 69% respectively.however, there
2018.whereas> Cap or Punc
lowest>Article
Local taxes percentage was low(91.2m) in 2017 from 2018,it was 102.3m> SM
where ratio had 38m and 38.5m in both year.> SM
n money spent, there are 3 individuals sectors, where highest amount is in salaries, which is 75% and 69% respectively.however, there > Unclear and sm
Band : 5.0
The table and charts detailed below give data about the police ailocated money in the year 2017 and 2018 on area The Britain.
overall, in the table budget 2017-2018 in sources most highest in the national government in 2017 year 175.5 m and very lowest in 2017 38 m other sources (eg grants). The charts detailed was the money spent in 2017 and 2018. In the 2017 highest salaries 75% and lowest technology 8% in the year 2017.
In items the table budget in 2017-2018 the sources. Other sources (eg grants) most similar in 2017 38 m and 38.5 m in 2018.Local taxes sources 91.2 m in 2017, but it is developed in 2018. The table all items sources in total 304.7 m in 2017 and 318.6 m in 2018.
Secondly, The charts was the money spent in the two years in 2017-2018.
The table and charts detailed below give data about the police ailocated money in the year 2017 and 2018 on area The Britain.> SM and SP
overall > Cap
verall, in the table budget 2017-2018 in sources most highest in the national government in 2017 year 175.5 m and very lowest in 2017 38 m other sources (eg grants). The charts detailed was the money spent in 2017 and 2018. In the 2017 highest salaries 75% and lowest technology 8% in the year 2017. > Unclear overview
In items the table budget in 2017-2018 the sources> SM
Band : 4.5
The table chart illustrates about the police budget and the sources of money in 2017 and 2018, while the pie charts compare between 2017 and 2018 how the police spent the money in Britain.
Overall, in pie charts ,the figures showed that the money was spent more on salaries ( officers and staff) and it was higher in percentage than other remaining sector. In table chart, the total budget of the police was similar in both years.
In terms of sources, from the national government highest amount of money was added to the budget, at about 175.5m and 277.8m,in both respective year. Local taxes were second on the list in 2017 and 2018, which was 91.2m and 102.3m. At last, others sources also contributed almost same amount of money in both year, at about 38m.
In concern of 2017, in salaries most percentage of money was spent, at 75%, whereas in technology, and buildings & transportation it was 8% and 17% respectively. Likewise , in salaries highest number of money was spent, at 69% in 2018. And other both sector was quite l
sector, year> WF
the total budget of the police was similar in both years.> SM
from the national government highest amount of money was added to the budget, > Unclear
Local taxes were second on the list in 2017 and 2018, which was 91.2m and 102.3m.> SS
most percentage of money was spent,> SM
it was > Tense
Band score : 5.5
And other both sector was quite > Incomplete
The table illustrate about the budget in 2017- 2018.On the other hand the pie chart inform about money spent.
Overall, the national had government had increase the other sources. rate was smiler in between in this yea .However selaeries are decrease and buildings and transport was also similar in two year.
In terms, national government was highest rate 2017 but it decrease 2% in this the next year. The taxes are increase in 2008 in 102.3m.In 2018 in 102.3 m pound. Which 91.2 million pound 2017.
However the other sources almost sources most same, in two years 2017 and 2018 in 38 million pounds respectively.
In 2017 saleries highest rate 75 but it decrease less than 6% 2018. Transport and buildings also same between years. The technology was 8% it increase 2018 in 4%.The other side of the officers staff in 2017 was 75%.
illustrate> WF
2018.On > Space
the national had government had increase the other sources. rate was smiler in between in this yea > SM , Unclear
However selaeries are decrease and buildings and transport was also similar in two year. > SP and SM
terms, national > Punctuation
national government was highest rate 2017 but it decrease 2% in this the next year. > SM
The taxes are increase in 2008 in 102.3m.In 2018 in 102.3 m pound. Which 91.2 million pound 2017. > SM
However > Punctuation
In 2017 saleries highest rate 75 but it decrease less than 6% 2018. Transport and buildings also same between years. The technology was 8% it increase 2018 in 4%.The other side of the officers staff in 2017 was 75%. > SM, Unclear
Band : 4.5
The table chart illustrates information about the police allocated money of Britain, in the year of 2017 and 2018.
Overall, There are 3 sectors of budget firstly National Government, Secondly local axes, and lastly other sources (eg grants). Police earn there highest budget from National Government. and lowest budget from other sources(eg grants).
However, the government was highest amount of the sources of budget. In the year of 2017 National Government gave the police 175.5m Pound, and the next year national government gave the police 177.8m Pound. The highest amount of the money in the year of 2018. In 2017 local taxes are 91.2m Pound and 2018 local taxes are 102.3m Pound we saw that 2018 are local taxes increased sharply.
In concern of 2018 is one of the big budget year and 2017 are lowest from 2018.
No paragraphing at all
The table chart illustrates information about the police allocated money of Britain, in the year of 2017 and 2018. > No data about the pie
No separation between overview and body paras
No overall progression and DATAs are unclear
Band score : 4.5
The table illustrates about the of the budget 2017- 2018 in the money spent in england.
overall, the highest was 2017 is national government are 175.5m. and the lowest was other sources is 38m. IN the pie 2017, salaries 75% in other salaries for staff and officers. in the year 2018, was decrease 69 less than
In terms, the budget was in national government was 175.5m and the 2018 was 177.8m. In local taxes was 2017 is 91.2m. and 2018 it is increase more than 11%. and other resources was 38m just little 38.5m.
on the other side, The salaries of the officers and staff in 2017 was 75%. It is the highest salary in this year. In transportation and buildings, was 17%. and the technology was 8%. In 2018 , salaries was 69% and technology was 14% and buildings was 17%. it is the same was buildings both the year.
The table illustrates about the of the budget 2017- 2018 in the money spent in england. > SM
l, the highest was 2017 is national government are 175.5m. and the lowest was other sources is 38m. IN the pie 2017, salaries 75% in other salaries for staff and officers. in the year 2018, was decrease 69 less than > Poor overview and SM
terms, the budget> Cap
In local taxes was 2017 is 91.2m. and 2018 it is increase more than 11%. and other resources was 38m just little 38.5m. > SM
, The salaries > Cap> on the
. it is the same was buildings both the year. > SM
Band : 5.0
The table chart illustrates information about the police budget in the years 2017 and 2018 in on area of Britain, while the pie chart chart information about the money was spent in 3 different sector.
Overall, the largest budget was National Government in 2017, while the least budget was Others sources in 2018. Both of the years highest money was spent in Salaries compares others sector.
In terms of 2017, National Government had the highest budget comapres others sector, which was 175.5m, but 2018 this figure had the slighty increase and reached 177.8m. However, Both country had the almost similar budget in Others sources. In contrast, local taxes increse slightly from 91.2m in 2017 to 102.3m in 2018.
On the other hand, the lergest money was spent in Salaries officers and stuff compares others in 2017 and 2018, which was 75% and 69% 2017, however technology had the lowest spent money in 2017, but this figure increse in 2017, which was 8% to 14%, in contrast similar spent money in Buildings and transport which was 17% in both countries.
in on> WC
chart chart information > Word missing
sector, > WF
slighty > SP
Both> Capitalization
increse > SP
compares others in 2017 and 201 > SM
Band : 6.0
The table illustrates information about the detalied of police budget during the one year period and the pie charts provide information about spending money by using three catagories in Britian, from 2017 to 2018.
Overall, the most amount of police budget had in 2018 in all categories, while expending money had the lowest fall on technology over the year.
In terms of national government, police budget was 175.5m at the beginning of the poeriod that rose to 177.8m at the ending of the period, which had the largest amount for police cost. Similarly, local taxes, almost 11.3m budget had risen in 2018.Notably that police budget on other sources was almost equal that had accounted for 38.5m.
In contrast, the highest spendimg sector had on salaries for offices and staff in 2017 that declined by 6% in 2018. Converesly, money expense on tecnology rose by 6% over the year, however, disbursing money in building and transport had similar portion that accounted for 17% both 2017 and 2018 respectively.
detalied, expense > WF
by using > Pre.
the most amount of police budget had in 2018 in all categories, while expending money had the lowest fall on technology over the year.> Write separately
, local taxes, almost 11.3m budget had risen in 2018. > SM
2018.Notably > Use space
he highest spendimg sector had on salaries for offices and staff in 2017 > SM
Band : 6.0
The table and charts depict information about the police budget in one area of Britain in 2017 and 2018,including where the money came from and how it was spent.
Overall,the total police budget increased slightly in 2018 compared to 2017.The main source of income in both years was the national government, while the biggest part of the spending went on salaries.
In 2017,the total budget was 304.7 million pound which rose to 318.6 million pound in 2018.The amount from the national government went up a little form 175.5m to 177.8m. Local taxes also increased notably from 91.2 million pound to 102.3 million pound, while other sources rose only slightly from 38 to 38.5 million pound.
In terms of spending, salaries made up the largest portion in both years,although the percentage dropped from 75% in 2017 to 69% in 2018.The proportion of spending on technology doubled from 8% to 14%, while the figure for buildings and transport remained stable at 17% in both years.