The chart below shows the amount of money per week spent on fast foods in Britain. The graph shows the trends in consumption of the fast food.
The chart below shows the amount of money per week spent on fast foods in Britain. The graph shows the trends in consumption of the fast food.
the bar charts indicate the amount of money seven days spent on fast food in UK , while the line charts show consumpttion .
of fast food .
overall , hamburgers is highest rate of high income of this graph . pizza is the lowest rate of total of this graph . Hamburgers and pizza were increase except fish and chips .
In terms of high income , Hamburger is not only highest rate of high income , but also high rate of this chart although , fish and chips and pizza were lowest compared to others fetures . Average income is average total . pizza is lowest rate of this graph .
In respect of hamburger , it was supreme rate of this line chart , which was did not down anytime , around 510 grammes. pizza was next place , after hamburger , which was a partly incrase odf this chart . fish and chips were falled slightly of this graph around
The bar chart provide information the amount of money weekly spending on three types of fast food by three income groups in Britain. while the line graph shows the consumption trends of the same fast food between in year of 1970-1990.
Overall, high income groups spend on the fast food . while others groups low income spend in few money . Hamburgers had the highest on every item the expect without low income. Again consumption of the fast food in hamburger in highest 500 grams .
one the one hand , fast food by income groups highest income hamburgers 45% and the low
The bar chart illustrates the amount of money per week expenditure on fast food in Britain ,while the line chart compares consumption of fast food during 20 years period, starting from in the year 1970.
overall, Hamburgers had the highest amount on every item than expect without low income ,on the other hand had the most expenditure of money again Hamburgers compare other product Fish and chips on pizza.
In terms of hamburgers had the most demandable choice on high income approximately 42 number, while hamburgers was the least amount on expense which counted for on average income at 11 of number. Furthermore Fish and chips had the most spent on average income exactly 25 of figure choose this item.
The bar chart provide information the amount of money weekly money spending on three types of fast food by three income groups in Britain. while the line graph shows the consumption trends of the same fast food between in year of 1970-1990.
Overall, high income group spend on the fast food. while others groups low income spend in few money. hamburger had the highest on every item expect without iow income Again consumption of the fast food in hamburger in highest 400 grams.
one the
The bar chart illustrates that how much money spent on three types of fast foods in Britain, while the the line graph provides information about the figure of food items consumed between 1970 and 1990.
Overall, the most popular items was Hamburgers where spent more money by high income groups, whereas the least of amount spent on Pizza by the groups of low income.
In terms of Hamburgers, the groups of high income spent 40 , followed by average income groups which was nearly 35 and the low income groups was spend about 14. Moreover, the amount of fish an chips where spent almost 19 by higher groups and lower groups , while average groups expended 25. On the other hand , the expenditure of pizza just near to 20 by high income grou
The bar chart provides information about the amount of money each week spent on fast foods in Britain whereas, the line graphs illustrates the trends in consumption of the fast food.
overall, Hamburgers has the highest figure compare to others while pizza has the lowest except one figure, while, Hamburgers surpassed fish and chips and increased sharply.
Regarding the bar chart, expenditure on Hamburgers were the highest income which was around 45 . The second highest expenditure was on fish and chips , the amount was at 25 by Average income group. However, the expenditure on pizza was less than fish and chips except one time.
In 1970, fish and chips decreased and increased while consumption of Hamburgers increased sharply in 1990. . Hamburgers surpassed both pizza and fish and chips.
The line chart and bar chart compares the number and percentage spent on fast food in Britain between 1970 to 1990 per week .
Overall, Hamburgers had the highest amount of fast food in both groups compares with pizza has the lowest except Hamburgers and pizza overtook fish and chips and increases significantly .
Regarding, the highest fast food by high income was around 45 percentage and the Average income was followed by high income was 38% .However, the percentage of expenditure in low income was 18% which had the least of the amount .
The line chart illustrate the amount of money spend on fast food in 1970 to 1990,while the bar provide us the amount of money income on fast food per week .
overall ,In Hamburgers they earn and spend highest number of money in both bar and chart . Pizza has lowest amount of money they earn per week .Fish and chips has lest amount spend in 1990.
In trams of bar , by hamburgers people earn big amount of money 3dgjeoirutg
The bar chart illustrate the amount of money per week expenditure on fast food in Britain, While the line chart compares trends in consumption of the fast food in the year 1970 to 1990.
Overall, Hamburgers had the highest on every item the expect without low income. Again consumption of fast food in hamburgers highest 500 grams .
In terms of high income and average income spent for Hamburgers in approximately 42 number ,
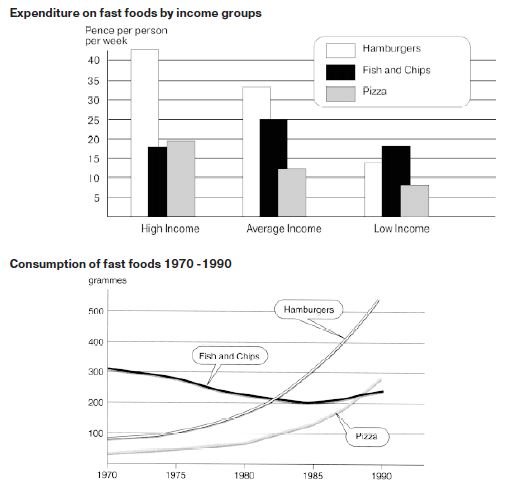
The bar chart illustrates weekly spending on three types of fast food by three income groups in Britain. The line graph shows the consumption trends of the same fast food between 1970 and 1990.
Overall, high income groups spend on the most in fast food. while others groups low income spend few money, then consumption of fast foods in the huge increase by hamburgers and fish and chips or pizza is similar grams.
On the one hand, fast food by income groups high income Hamburgers 45% per person per week earn, and fish chips and pizza is 20%.while low income 20 percent all three categories,
The bar chat illustrates hoe money every week spent on fast food in Britain consumption of the fast food.
overall, the highest expenditure on fast foods per week were the Hamburgers in three iteam . while pizza were the lowest in the figures . also second line graph Hamburgers were the same position but pizza had declined.
In terms of expenditure on fast food income group Hamburger were the highest at up 40 on high income three item on Fish and chips, also pizza. while pizza, fish and chips were most different .high income were similer about 17.
consumption on fast food 1970 to 1990 firstly 100 but it increased in time up 500, which followed by pizza were from 1970 to 1990 almost 300.
The bar chart and line graph compares the figure of money per week on fast foods in Britain and the trends in consumtion of the food in 1970 and 1990.
Overall,The expenditure on fast foods income groups in high income and average income group is the highest spent is Hamburgers .While the lowest spent in low income is fish and chips. Consumption of fast food is increagement in Hamburgers and pizza. Other side,fast food decreage in fish and chips.
In Britain, the ultimate highest amount in high income and average income in hamburgers is just over 40 and pizza . While the lowest amount in low income is
The bar chart depict how much money expend in various fast food by per week across Britain ,while the line graph present the number of people who eating these fast food.
Overall, hamburgers is highly popular across Britain, whereas high income included person significantly choose this fast food and low income related person dislike pizza. In addition, smallest amount of fish and chips eating 1970 to 1990.
The bar chart and the graph illustrates the amount of money per week spent and the trends in consumption of the fast food in Britain.
Overall, hamburgers was the highest amount in high income group and pizza was the lowest amount in low income group than than the other group. The consumption demand of hamburgers and pizza was increased while, the consumption demand of fish and chips was decreased within 1970 to 1990.
In terms of income group, hamburgers was the highest amount in every income group except low income group. Fish and chips was the second highest amount in every income group. The amount of pizza decreas