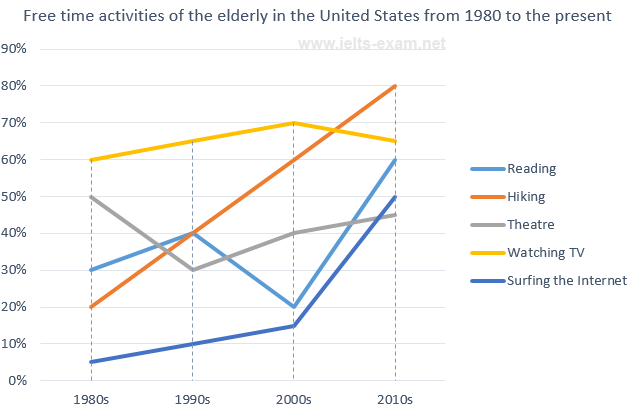
The graph below shows how elderly people in the United States spent their free time between 1980 and 2010.
Summarise the information by selecting and reporting the main features, and make comparisons where relevant.
The graph below shows how elderly people in the United States spent their free time between 1980 and 2010.
Summarise the information by selecting and reporting the main features, and make comparisons where relevant.
The line graph illustrate the US people spent their free time in the year 1980 to 2010.
Overall, hikking rate had dramatically increase. However theatre and surfing the internet increase rate had almost similar.
In terms, watching tv was highest percentage in 1980 in 60%, and after 20 years it had 20% increase but it had 5% less in 2010. However, hikking proportion had dramatically increase in 1980s to 2010s in 20% to 80%. It was highest rate in 2010s. On the other hand, theatre was second highest rate in 1980s and it decrease lees than 20%. In 2010s it had increase in 15%.
In 1980s surfing was lowest rate in other people free time in 5% and after 20 years it increase in 15%. In 2010 it dramatically increase in 35%.
illustrate the US people spent their free time > SM
hikking > SP
However> Cap
theatre and surfing the internet increase rate had almost similar> SM
In terms, > P.
In terms, watching tv was highest percentage in 1980 in 60%, and after 20 years it had 20% increase > SM
increase in 1980s to 2010s in 20% to 80%.>SM
theatre was second highest rate in 1980s and it decrease lees than 20%. In 2010s it had increase in 15%.> SM
In 1980s surfing was lowest rate in other people free time in 5% and after 20 years it increase in 15%. In 2010 it dramatically increase in 35%.> Unclear and SM
Band score : 4.5
The line graph illustrate the people spent their free time the year 1980 to 2010.
Overall, hiking had the highest proportion rate was activities, was and theatre and surfing internet increase almost rate that similar.
In terms watching tv was highest percentage shows bellow in 1980 in 60% and after that it was 20%increase but it had 5% less than. however, the hiking proportion dramatically was increase in 1980 to 2010 in 20% to 80%. it was highest rate 2010s. On the other hand the theatre was second highest rate in 1980 was decrease less than 20%. 2010s its decrease increase in 15%.
In 1980 was surfing was lowest rate in other people in free time in 5% and 20 years it was increase more than 15%. its was dramatically in increase was
illustrate> WF
the people spent their free time the year 1980 to 2010.> SM
hiking had the highest proportion rate was activities, was and theatre and surfing internet increase almost rate that similar. |> SM and Unclear .
In terms watching tv was highest percentage shows bellow in 1980 in 60% and after that it was 20%increase but it had 5% less than. however, the hiking proportion dramatically was increase in 1980 to 2010 in 20% to 80%. it was highest rate 2010s. On the other hand the theatre was second highest rate in 1980 was decrease less than 20%. 2010s its decrease increase in 15% |> SM
Band Score : 4.5
The line graph illustrates about adult people in the United States from 1980 to 2010, and what kind of activity they do in their free time.
Overall, the percentage of doing free time activity such as hiking, reading, watching TV, surfing the internet had been increased over the period, while the percentage of watching movie in theatre had been decreased in the meantime.
In terms of hiking, in the year 1980, it had 20%, which increased rapidly and reached 80% in the final year. Moreover, surfing in the internet was steadily increasing from the initial year, but from the year 2000 it increased massively and in 2010 it finished with 50%.
in concern of watching TV, in the starting it had 60%, and was increasing slightly year by year, however, from 2000 it started decreasing, and ended with 65%. In case of reading, it fluctuated over the years and, was initially at 30%, and in 2010 it had 60%. Only theatre was decreased from the initial percentage.
what kind of activity they do in their free time. |> Tense
, in the starting |> Punc.
and, was initially at 30%, > SM
. Only theatre was decreased from the initial percentage. ||>SM
Band : 6.0
The line chart illustrates how old people in the United States spent their free time from 1980 to 2010.
Overall, the highest proportion was Watching TV in 1980 and in 2010 Hiking, while the lowest proportion was Surfing the internet in 1980, and in 2010 Theater. Moreover, in 2010, Theater and Surfing the internet it is almost similar.
In terms in 1980, most of the old people chose Watching TV ,at 60%, which it increased gradually in 2000, at 70%, and next 10 years this figure had a small decreased, at 65%. However, Theater is the second proportion in the old people in 1980, at 50%, while in 1990, it fell extensively, at 30%, which in 2010, it went up, at 45%.
Moreover, Reading was liked 30% old people, whereas in 2000, it went down, at 20%, moreover in 2010, it was rose significantly, at 60%.
In addition, Hiking chose 20% people in 1980, whereas in 2010, it hit the top position, at 80%. Furthermore, Surfing the internet preferred 5% old people in 1980, while in 2010, it increased dramatically, at 50%.
was Watching TV > Missing word
Moreover, in 2010, Theater and Surfing the internet it is almost similar.|> SM
In terms in 1980||> WC
which it increased gradually in 2000,|> SM
Theater is the second proportion in the old people in 1980|> SM
, Reading was liked 30% old people |> Sentence structure
it was rose significantly, at 60%.|> SM
Hiking chose 20% people in 1980, whereas in 2010, it hit the top position, at 80%. Furthermore, Surfing the internet preferred 5% old people in 1980, while in 2010, it increased dramatically, at 50%|> Sentence structure
The picture illustrates data about spending leisure time on five different activities by American people from 1980 and 2010.
Overall, the percentage of hiking activities increases over the time, while theatre witnessed a decline in the end of period. However, watching tv was initially highest portion compared to other activities.
In 1980, 5% American peoples spent their time on browsing internet, which was lowest, witnessed a significant rise to 15% in the next 20 years, and this figure rose surprisingly at 60% in the end of the period. Moreover, spending spare time on hiking accounted 20% in 1980, which increased dramatically to 80% in 2010, positioned highest compared to others. Although people who love to read was 30% at the beginning , but this figure went doubled in 2010.
In terms of theatre, in 1980, elder pupils spent their free time on this activity was half of the total population, before having a dramatic decline to 30% in 1990, and this figure reached to 45% at the end. In contrast, Watching tv, was the highest initially , which counted 5% rise over a 30-year period.
increases|> WF
watching tv was initially highest portion |> Sentence Making
which was lowest, witnessed |> SM
positioned|> WF
, before |> Punctuation
tv, was the highest |> Sentence Making
The line graph illustrates the percentage of people spending their time on five different activities in the united status from 1980 to 2010.
overall, although the proportion of watching tv was the highest in the initial period while, others activities least the lowest percentage. however, hiking received the highest proportion on the top in 2010.
In terms of surfing the internet, it was the lowest yet this figure continue to rise in the upcoming years and it is predicted to reach 50% in the year 2010. reading on the other hand, it was increase dramatically in 1990s but after that it was slowly droffed in 1990 to 2000 than reading grew in l
in the united status |> Capitalization
overall |> Cap
, others activities least the lowest percentage.|> SM
. however |> Cap
continue|> WF
it is predicted |> Structure Selection
Band Score : 5.0
The line graph illustrates elderly people in reading, Hiking, Theatre, Watching TV, and surfing the internet spent their free time in the 1980 and 2010.
Overall, this line graph in 1980 and 2010 . Watching TV free time activities of the elderly in the United States from 1980 to the present used 60%, but 2000 year people used 70%. Surfing the internet used in 1990 year 10%, then 2010 years used the highest in this graph 50%.
In items reading lowest in 2000 year and highest in 2010 . Hiking is very fast imporving in 1980 to 2010. this items 20% in the 1980, while 80% people very used hiking in 2010. At first Theatre 50% people free time activities of the elderly in 1980, but it is not imporving in 1990 to 2000.
The line graph illustrates elderly people in reading, Hiking, Theatre, Watching TV, and surfing the internet spent their free time in the 1980 and 2010.|> SM
this line graph in 1980 and 2010 .|> SM
Poor overall ….
In items reading lowest in 2000 year and highest in 2010 . Hiking is very fast imporving in 1980 to 2010. this items 20% in the 1980, while 80% people very used hiking in 2010. At first Theatre 50% people free time activities of the elderly in 1980, but it is not imporving in 1990 to 2000. |> SM
Band Score : 4.5
The line chart illustrates information about the elderly people in the United States their free time between 1980 and 2010.
Overall, the number of Hiking was highest increased over the period, while a downward trend was Wathing TV and Theatre.
In terms of Raading, the elderly peaople spent their free time was 30% at the beginning in 1980, after that this figure increased slightly in 1990, then it was decline sighnificantly and reached from 40% to 20%, but this figure was growth deamatically from 2000 to 2010. Between 1980 2010, hiking was the highest increased dramatically and reached 20% to 80%. Moreover, from 1980 to 2000, surfing the internet was growth slightly and reached around 5% to 15%.
On the other hand, the elderly people spent their free time in Watching TV, which was increased slightly and reached from 60% to 70% betweeen 1980 to 2000, after that this figure slightly decline in 2010 and proportion was around 65%. In contrast theatre , this figure was decline sighnificantly from 1980 to 1990, after that this figure was slightly increased and reached 30% to around 45% in 2010.
illustrates information about the elderly people in the United States their free time|> SM
the number of Hiking was highest increased over the period, while a downward trend was Wathing TV and Theatre |>SM
Raading,peaople |> SP
then it was decline sighnificantly and reached from 40% to 20%, but this figure was growth deamatically from 2000 to 2010. |> SM
but this figure was growth deamatically from 2000 to 2010. |> SM
Between 1980 2010, |> illegible
Moreover, from 1980 to 2000, surfing the internet was growth slightly and reached around 5% to 15%. |> SM
was increased slightly|> SM
, this figure was decline sighnificantly from 1980 to 1990, after that this figure was slightly increased and reached 30% to around 45% in 201|> SM
Band score : 5.0
The line graph illustrates the number of elderly people spent their free time in united states between 1980 and 2010.
Overall, hiking rate was increasing the highest among in all other activities. the lowest was the theatre in all other features.
In terms, The hiking rate was in 2010 was 20%. it increased dramatically at 80%. after that the reading was started in 1980 . and it goes at 2010 at 60%. and the theatre beginning at 50 % increasing and ended 2010 in 45%.
on the other side, The watching tv was the older people the second highest in any other activity. the surfing the internet started at 1980 it goes little bit increased and dramaticallly in 2010
in united states > SP and Article missing
the lowest was the theatre in all other features. > SM
In terms, The hiking rate was in 2010 was 20%. > SM
after that the reading was started in 1980 . and it goes at 2010 at 60%. and the theatre beginning at 50 % increasing and ended 2010 in 45%. > Unclear and SM
on the other side, The watching tv was the older people the second highest in any other activity. the surfing the internet started at 1980 it goes little bit increased and dramaticallly in 2010 >SM
Band score : 4.5
The graph illustrates how the aged people of United States consumed their leisure time in the year between 1980 and 2010.
Overall, watching tv was the highest pattern of this graph. Hiking was increased dramatically in the meantime. Theatre starts with a remarkable number but ends at the lowest.
In details, reading had 30% in 1980s, and it increased to 40% among 10 years impressivly, Hiking was the only pattern which never decreased in the meantime. Theatre fluctuated from 50% to 30% at the first 10 years. Than it started increasing, it increased 15% in the next 20 years.
In terms of watching tv, it had a good number from starting, it had
consumed > WS
of United States > SM
increased 15% > Preposition Missing
Incomplete writing …………..
Band Score : 5.5
The line grpah provides information how elderly people expend there lesiure time by doing various activities in USA, from 1980 to 2010.
Overall, spending time on hiking increased gradually over the period, while other activities were flauctuated during this period. However, spending time on watching television had higher rrather than other categories at the begining of the period.
between 1980 and 2000, spending time on watching televisio had from 60% to 70%, and then it had a slight fall by almost 5% in 2010. However, theatre, had 50% at the beginning of the period that fall by 20% in 1990, before risen by around 15% at the end of the period. Conversely, reading ,older people disbursed exactly 30% in 1980, ehich had fallen dramatically in 2000 before reaching its peak at 60% in 2010.
In contrast, older people spent the lowest amount of time on reading at the started of period, while it went up tremendously by 60% in 2010.
The least amount of time expended on surfing the internet rather than other sectors that had a minimal growth in 2000, after this it climbed by 35% in 2010.
how > Word missing
USA > Article missing
rrather, televisio > SP
between> CAP
televisio had from 60% to 70% > SM
risen > WF
ehich > SP
The least amount of time expended on surfing> Structural error
Band score : 6.0
The line chart shows how elderly people in the United States spent their free time from 1980 to 2010.
Overall, the popularity of most activities increased over the period, especially hikinig and surfing the Internet, whilst the percentage of elderly people going to the theatre decreased slightly.
In 1980, watching Tv was most common activity, at about 60%,and it remained high throughout the years,reaching around 70% in 2010.Reading also became very popular, rising from about 30% in 1980 to 60% in 2010,although it dropped a little in 2000.
Hikinig showed the biggest growth, starting at only 20% in 1980 and increasing sharply to 80% in 2010. In contrast,the percentage of people going to the theatre fell from 50% in 1980 to about 30% in 2000, then rose slightly again in 2010.Surfing the Internet, which was almost zero level in the year 1980, became much more common by 2010, reaching around 50%.
Paragraphing errors
most > Article
Band Score : 6.5