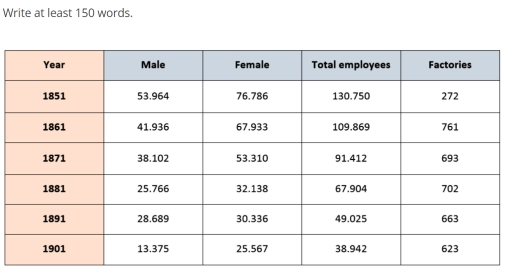
The table shows the number of employees and factories producing silk in England and Wales between 1851 and 1901.
Summerize the information by selecting and reporting the main features and make comparison where relevant.
The table shows the number of employees and factories producing silk in England and Wales between 1851 and 1901.
Summerize the information by selecting and reporting the main features and make comparison where relevant.
The table illustrate the amount of workers and industry producing silk in England and Wales from 1851 to 1901.
Overall, The higher percentage is total worker in 1851, while the lowest percentage is male in 1901. Moreover, in 1891, male and female worker nearly similar.
In terms, male is the higher in 1851, at 53,964, while in 1901, it fell significantly, at 13,375. However, in 1851, females worker was 76,786, which next 50 years it decreased dramatically, at 25,567.
In addition, in 1852, the total worker had 130,750, whereas it is decreased in 1901, at 38,942. Furthermore, In 1851, the industry was 272, which it increased in 1881, at 702, however after 10 years, the industry decreased slowly, 663. However, in 1901, the industry again went down, at 623.
The table chart illustarte the number of two diffierent silk in England and wales between in year 1851 and 1901.
Overall, summerize the date by selecting and reporting the main features and make comparison year , male female, employees, factories. factories highest in the year 1861 and male highest in the year 1851.
In the items total employees 130.750 in the 1851 year. it is not imporving in day by day. At last 1901 year lowest 38.942 . Female information in table chart lowest 25.567 and it develop in 1851 year this information 76.786 .
The factories date in 1851 to 1901 year (272,761,693,702,663,623). factories highest date in 272 less then 761 in 1861. Male is very diffierent information in 1851 – 1901 year.
The table illustrate the England employees and factories skill in the year 1851 to 1901.
Overall, female and total employees was highest in 1851, and the factories was highest in 1861. However, male was lowest in 1901.
In terms, the number of total employees was highest than other numbers in 1851 in 130.750 and 1901 it was lowest in 38.942 in 1901. However, male and female almost same in 1891 in 28.689 and 30.336 respectively. On the other hand, factories was highest rate in factory others number in 1861 in 761.
In 1901 male was very lowest and the rate was 13.375. Whereas, the female percentage is 25.567.
The picture illustrate the amount of workers and factories manufacturing silk in two countries from 1851 to 1901.
Overall, the highest proportion of producing silk was female sector, while male portion was bit lowest. However, factories amount dramatically grew in those period.
In terms of Female, at year of 1851,female silk production was highest in 76.786. Afterwards, it was continiously decreased per year, which was 67.933,53.310,32.138,30.336,25.567 respectively, but in this sector factories number were up gradually.
In male, the number of male was lowest than the female, whereas it was dropped rest of the period. It started from 53.964 production. Then continiued the fall stand in 13.375, which was lowest from all the sectors. Total employees and factories amount was reliable . they was grew in those sectors.
The table illustrates about silk production in England and wales from 1951 to 1901, and the the number of workers and factories of it.
Overall, in the initial year, the number of male and female workers were much higher , while in terms of factories, initially there were less factories , and in the final year it increased rapidly.
In 1851, both the male and female workers were higher in number, which was 130750, and 272 factory producing silk during that time. After 10 years, the total number of worker was decreased by 20 thousand, and more than 500 new factories were built.
In the year 1871, the total number again decreased and little fore factories were built. In the following, the number of factory was increased by 9, which was too less than previous. In 1901, there were the least number of workers, at about 38942, however , the number factory was decread in that period
The table shows illustrate the portion of England employees and factories skill in the year 1825 to 1901.
Overall, from the chart it evident that in 1871 most of employees interest in worked. Female and total employees was highest in 1851, and the factories was highest in 1861. However, male was lowest in 1901.
In concerm of 1851, most of employees was highest in 1851 in 130.750,in 1851 in 130.750 and 1901 lowest in 38.942 .Most of the employees both male and female preferrd working in producing skill the number of factories are only 272. After 10 years, both employees decited interest whilst the factories.
In 1901 male was very lowest and rate was 13.375.Whereas, the female percentage 25.567. 4
The table chart illustrates the data about how much silk produced by workers and factories in England and Wales from 1851 to 1901.
Overall, the highest number of male and female workers produced silk in 1851, however, producing silk in 1901, witnessed a least number of workers. Moreover, female workers were assigned more than the male workers in every year.
In 1851, total employees from 272 factories were 130,750 ,which was the highest, in that case female workers were higher by almost 23,000 than males. In the following years, the number of male and female workers was ranged between 40,000 to 70,00 from 761 factories, and this digit is higher by 68 factories in the next ten years.
In terms of males, accounted 13,375 employees in 1901, which was lowest compared to others, and this figure went almost doubled in concern of female workers. In 1881 and 1891, the total employment in 702 and 663 factories were 67,904 and 49,025, whom produced silk respectively.
The table illustrates about the number of workers and factories producing silk in United Kingdom, in the year of 1851 to 1901.
Overall, there are two chatagories of workers, male and female workers. In the year of 1851, initially were less factories and the final year the factories were increase rapidly.
In the contrast of, the female workers higher than the male worker in the all year. In 1851, the total worker are 1,30,750, and last year total employees are 38,942. The total employee decreased in the last year.
On the other hand, the employee were decreased but the factories were increase rapidly. In the following, the number of
The table shows illustrates how to produced the employers great britain and wales between 1851 and 1901.
overall, the highest percentage of male was in 1851 was 53.964 and the female was 76.786..the total employees are in 1851 was 130.750. the lowest was in 1901 was 623.
In terms of the employees , the female was 76.786 more than great well. in 1861 the male was 41.936 and the female was 67.933 better than male. In 1871, the male was 38.102 and the female was 53.310 greater than male.
on the other side ,1881 the male was 25.766 and the feamle was 32.138 well that male. after 1891 the male was 28.689 and the female was 30.336 lowest than just 25. in 1901 the male was 13.375 and
The table illustrates the numbers of staffs and manufacturing silk between England and Wales in the year 1851 to 1901.
Overall, the table shows the proportion of male and female in different sectors in different factories. In 1851, the industry has a big workforce with 130,750 workers. The highest number of factories was in 1861s.
In 1851, the number of female workers was much more than male workers and it was the highest number including 76,786 female and 53,964 male workers. The lowest proportion was in 1901. The number of workers was reduced day by day.
In 1861, the wo
The table illustrates the portion of workers and companies producing Silk in England and Wales from 1851 to 1901.
Overall, from the chart it is evident that in 1871 most of employees were interested in working factories though the number of companies were low. However, the male members were less interested in working in this sector.
In concerns of 1851, most of the employees both male and female were preferred working in producing silk but the number of factories are only 272. After 10 years, both employees were depicted less interest whilst the factories were thrice and the number was 761. In 1871, both factories and workers proportion dropped with 68 factories and 9700 workers.
In 1881, again factories are increased but workers were only 67,904. After 10 years, male members increased 3000 and female workers slightly decreased with 2000 members. In last decade, both workers decreased and the workers were only 38,942 and the factories were only 623 at en
The table illustrates about the information of workers who produced silk in England and Wales industry, from 1851 and 1901.
Overall, higher percentage of total worker in 1851 than that of others. In 1851, he percentage of employee work had the highest increase in factories, while the least amount of work had shown at the beginning of the period.
In 1851, the number of male worker had 53,964 that had increased at 76,786 at female. Notably that female worker had risen rather than male worker throughout the period that ranged between 13, 375 and 67, 933 respectively.
In contrast, total employment in 1851 had substantyially grater rather than 1901, 1891, 1881, 1871 that were accounted for 38,942,49,025,67,904, and 91,412, whereas tatal employment had almost 22,000 had less than 1851. However, in 1861 workers work in factories had the hihgest instead of others period that had from 272 to 761 respectively.