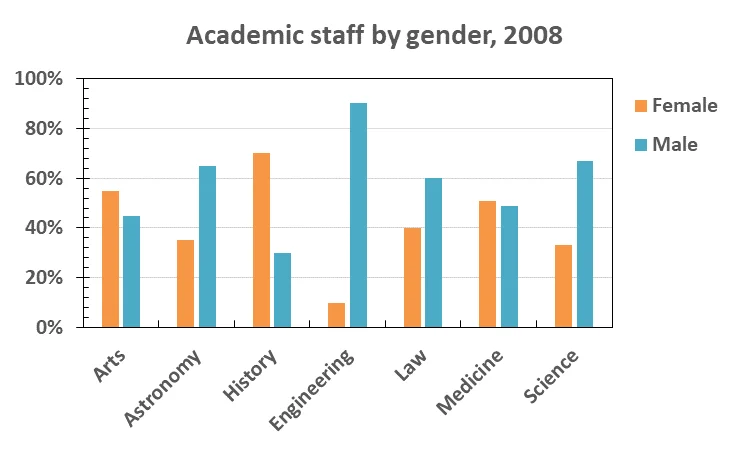
The bar graph shows the percentage of male and female academic staff members in different faculties of a particular university in 2008.
Summarise the information by selecting and reporting the main features, and make comparisons where relevant.
The bar graph shows the percentage of male and female academic staff members in different faculties of a particular university in 2008.
Summarise the information by selecting and reporting the main features, and make comparisons where relevant.
The bar chart displays the proportion of men and women academic staff members in different faculties of a particular university in the year 2008
It is clear that, men had the highest percentage in Engineering, while women had the lowest percentage in the meantime. In the chart the highest percentage is 90% and the lowest percentage is 10%
In terms of arts, women had 55% which is followed by men. However men had 65% in astronomy, while women had 35% in astronomy .In the next male had 30% in history, while women had 70% higher than that. Moreover men had 90% in Engineering which is the highest percentage in the chart, while women had only 10% in engineering.
On the other hand in Law male had 60%, while women had 40% lower than that. In medicine women had almost 51%, while men had 49% in this sector. In terms of science, women had almost 35%,while men had 75% higher than that.
#use sentence variations
#be cautious about ‘full stop’
#work on punctuation
#avoid mentioning data on overview
#that, – no coma needed
#In the chart – In the chart(,)
#while women had the lowest percentage in the meantime – while women had the lowest percentage/women had the lowest percentage in the meantime
#55% which – 55%(,) which
#However – However(,)
#In the next male had 30% in history, while women had 70% higher than that – wrong information
#y .I – be cautious about spaces
#In the next -.In the next(,)
#On the other hand in Law – On the other hand(,) in Law (,)
#male had 60%, while women had 40% lower than that – wrong information
#men had 75% higher than that – wrong information
#male had 30% in history, while women had 70% higher than that – In history, males accounted for about 30%, while women’s percentage was almost 40% higher than that
BAND – 5.5
The picture displays the proportion of men and women educational staff members in various types of a particular university in the year 2007
Overall , in engineering the number of male is eight times higher then female. Although , the portion of male is much higher then female , in arts female is 20 % higher then male .
In concern of engineering the ratio of male is much higher as opposed to female . The percentage of male and female is quite similar in medicine . As compared to male in science academic profession female is lower .
In astronomy , male ratio is 62% where female ratio is 38 % . In every academic staff members it could be seen male ratio is higher as compared to female but in history female ratio is higher then male . In terms of law similarly to other ratio male is higher then female .
#underlength
#avoid leaving space before (.) and (,)
#avoid mentioning data on overview
#poor overview
#work on tense
#various types of a particular university – various types of (sector in) a particular university
# in engineering – in engineering(,)
# Although , – no comma needed
# then – than
#In concern of engineering – In engineering/Regarding engineering
#male ratio is 62% where female ratio is 38 % – male accounted for 62%, while female was 38%
#In terms of law similarly to other ratio male is higher then female – sentence making
BAND – 5
The bar chart presents the ratio of men and women academic staff member in different faculties of a single university in the year 2008
Overall, man was the highest in engineering, while women had the lowest at the meantime. However both men and women had nearly similar proportion in medicine.
In terms of engineering, the percentage of men was the highest with approximately 90%, while women had the lowest at 10%. Moreover, women had more than 50% in arts, while men had less than 40%. In astronomy, the ratio of men was approximately 64% and men followed it with 36%. In contrast, women dominate the history sector with 70%, however, men was just 30%.
In low sector, men again led with 60% and women was 40%. In the medicine sector both men and women had shared nearly with approximately 51% and 49%. By contrast, men reserved 68% in the science profession, while women was 32% lower than that.
#man was the highest in engineering, while women had the lowest at the meantime – men had the highest proportion in engineering, while women had the lowest
#in arts, while men had less than 40% – wrong information
#the ratio of men was approximately 64% and men followed it with 36% – wrong information
#women dominate – women dominated
#women dominate the history sector with 70%, however, men was just 30% – women dominated the history faculty with 70%, while men comprised for 30%
#low – law
#medicine sector – medicine sector(,)
#was 40% – were 40%
#both men and women had shared nearly with approximately 51% and 49% – both men and women had similar proportions, approximately 51% and 49% respectively
BAND – 6.0+
The given bar chart provides information about the ratio of men and women academic staff members in various subjects of a particular university in the year 2008.
Overall, the highest ratio of man in the Engineering faculties ,while women was lowest at the meantime . Throughout the graph chart the men was highest everywhere except arts, medicine, and history.
In terms of male, they were highest at Engineering which was 90% ,while women was there lowest with 10%. However, in Medicine both male and female was quite similar they were around 50% . Moreover , in Science we saw that male had the ratio of 67% , while female was 27% which was half of male percentage .
In Astronomy , male was dominating with the percentage of 64% what was two time higher then female . On the other hand , Arts was leaded by female with the percentage of almost 55% . Moreover, In History again male was followed by female which is two time less then female, that time the ratio of female was 70%.
#avoid leaving space before (.) and (,)
#the highest ratio of man in the Engineering faculties ,while women was lowest at the meantime . – men had the highest ratio in Engineering, while women had the lowest/women had the lowest in the meantime
#at Engineering – in Engineering
#while women was there lowest with 10% – unclear
#in Medicine – in Medicine(,)
#both male and female was quite similar they were around 50% – both males and females were quite similar, at approximately 50%
#we saw that – avoid
#while female was 27% which was half of male percentage – wrong information
#what was two time higher then female – which was two times higher than female
#Arts was leaded – structure
#In History again male was followed by female which is two time less then female, that time the ratio of female was 70%. – wrong information, organisation and tense
BAND – 5.5
The bar chart demonstrate the portion of men and women academic staff members in various sectors of a specific university in the year 2008.
Overall, men had recorded highest portion in engineering ,while women was least in it. Male had lowest proportion in history, whereas female hold more portion in history.
In concern of engineering, male led the portion with 90 percent and female follow the less. Moreover, female on top by recorded around 55 percent from total, while men was less with slightly higher then 40 percent. In astronomy, on the other side, male was in top with approximately 65 percent and female was hold the portion under 40.
Regarding history, female rate on top with around 70 percent and male was lower then 40 percent of it. Despite the Law sector, male was led the rate with 60 percent, whereas female had only 40 percentage. In medicine faculties, both are slightly similar, but female recorded most and male was least with a difference of 5 percent. In science, male was top with 70 percent, whereas female had a half of that portion.
#overview could be better
#sentence making and structure error
#tense
#demonstrate – demonstrates
#recorded highest – recorded the highest
#In concern of engineering – In terms of engineering
#female follow the less – unclear
#male led the portion with 90 percent and female follow the less – sentence making
#then – than
#female was hold – female held
#Despite – wrong connector
# In medicine faculties – In the faculty of medicine
BAND – 4.5
The bar chart illustrates the proportion of men and women educational staff members in seven different faculties of a particular university in 2008.
It is clear that, the male had the highest in engineering, while female was larger in history. male was the most proportion than female.
In terms of engineering, the male was 90% in 2008, while female significant less at 10%. Moreover, In history, 70% ratio by female, this figure male was less than 1 time at 30%. Academic staff of female at 55% in arts, followed by male at 45%.
We can seen that, educational staff members in low male was 60%, at this time female expenditure at 40%. In medicine, both male and female almost same percentage female at 50% and just under that male was 48%. The male had ratio at 70% in science at this meantime female half of male at 35%. In contrast, astronomy had over the 60% by male, and female less than 35%.
#sentence making and structure error
#poor overview
#body 1 poor
#that, – no comma needed
#male had the highest in engineering – unclear
#We can seen that, – avoid
BAND – 4.0
The given bar chart provides information about the percentage of male and female academic staff members in different faculties of a particular university in the year 2008.
Overall the percentage of Engineering academic staff was led by male, while the lowest was male in the meantime. However, percentage of history academic staff was dominated by female.
In terms of engineering the percentage of female was the highest at 90%. while male had only 10% . On the other hand, history academic staff was dominated by female with 70% and male was 40 % less than that. In arts, the ratio of female was approximately 58% and it was foll0owed by male . In contrast medicine staff sector was less gap between male female where male in 52% and female were in 48%.
In science staff sector, more than 64% of the total staff were male , whereas the ratio of female was two times less than that. Moreover male academic staff was at 62% in astronomy, however this figure was 38% for female. By contrast female reserved 40% in law academic staff, and male was 20% higher than that.
#be cautious about space before (.) and (,)
#work on punctuation
#Overall – Overall(,)
#while the lowest was male in the meantime – while the lowest was male/the lowest was male in the meantime
#In terms of engineering – In terms of engineering(,)
#. w – (,)
#history academic staff – history faculty staff
#foll0owed – followed
#In contrast – In contrast(,)
#medicine staff sector was less gap between male female where male in 52% and female were in 48% – sentence making
#Moreover – Moreover(,)
BAND – 6.0+
The bar chart illustrates the percentage of male and female academic staff member in different faculties of a particular university in 2008 .
Overall man had recorded the highest in engineering as opposed to female ,which was the lowest .
In terms of t engineering , the percentage of male was the highest at 90% while female and only 10% , on the other hand , medicine sector was dominated by female 50% and male 5% less than that . In law the ratio of female was 40% , and the male was 60% .
on another one is art , the ratio of female was 50% up and the male was 40 % up .
Overall while history ratio of female was 70% and male was 30% , and the last one is astronomy the percentage of female was 30% and male was up to 60% .
#underlength
#work space before and after (.) and (,)
#sentence making, structure and organisation
#work on paragraphing
#Overall – Overall(,)
# 90% while – 90%(,) while
#by female 50% – by female at 50%
#on another one is art – Regarding the arts faculty,
#he ratio of female was 50% up and the male was 40 % up – unclear
BAND – 4.5
The bar graph displays the percentage of male and female academic collegue members in varities faculties of a particular university in 2008.
overall,Men had the highest proportion in the engineering sector,while the female least proportion was that sector .However both men and women had similar percentage in medicine sector in 2008.
In terms of Engineering the portion of male was the highest at 90%, while female had only 10%.On the other hand in the sector of medicine the ratio of both female or male are almost similar their portion almost 50%.In the science sector males percentage are increased half more than female.
In contrast, astronomy and law faculties female staff were also decreased than male .On the other hand in the arts and history groups the male proportion was down and female proportion was uper .at the arts the female amount 55% and male amount 45%.
#underlenth
#work on space and capitalisation
#tense
#body 2 – sentence making, structure and organisation
#However – However(,)
#while the female least proportion was that sector – while women had the lowest in this sector
#In terms of Engineering – In terms of Engineering(,)
#On the other hand – On the other hand(,)
#sector of medicine – sector of medicine(,)
#both female or male are almost similar their portion almost 50% – both female and male had almost similar portions at almost 50%
#both female or male are almost similar their portion almost 50% – sentence making
BAND – 4.5
The bar chart compares the proportion of men and women professionals in different of a particular university in the year 2008.
overall, the highest percentage of academic staff members was in the department of Engineering, which was reserved by male professionals, while female members were the least in that faculties. On the other hand, the portion of female professionals was the highest in History , whereas male staff were the least in that.
In the faculty of Engineering, the percentage of male staff was more than 80%, while female members were only 5%, which is a huge difference. The department of History was led by female staff at 65% , whereas the percentage of male staff was nearly 25% which was two times lesser than the female members. In the faculty of medicine , both men and women staff members were almost equal, although women members are slightly ahead .
In Science, male members were the highest in percentage ,and it was around 65%, while the female members were 25%. In the faculty of Arts, women were ahead of men ,though the difference
#overview could be better (only pick keypoints)
#incomplete
#The bar chart compares the proportion of men and women professionals in different faculties of a particular university in the year 2008.
#in that faculties – east in that faculty
#which is a huge difference – avoid
#two times lesser – less than half of
#although women members are slightly ahead – although women slightly outnumbered men
#In the faculty of Arts, women were ahead of men ,though the difference – unclear
BAND – 5.5
The picture illustrates the proportion of man and women educational staff in several types of faculties of a specific university in the year of 2008.
Overall, male were the most dominated in engineering with around 85%, while in opposite gender recorded its highest on history.
In terms of engineering and science, the percentage of male was the highest at approximate 85% and 65%,while female had only near to 7%.On the other hand, astronomy was dominated by male with around 62% and female was nearly 30% less than that.In history, the ratio of male was close to 25%, where female was 68%.In medicine sector both gender was shared equally ratio with nearly 50% in the same time.
In arts,more than 50% of the total ratio were female,whereas the percentage of law recorded 40% of female,while 60% was male.By contras,female contributed around 65% in history,and male was 10% higher than that,medicine shows similar ratio in both proporti
#poor overview
#do not mention data on overview
#work on organisation
#picture – graph/chart
#while female had only near to 7% – wrong information
#astronomy was dominated by male – astronomy was dominated by male employees
#In medicine sector – In medicine sector(,)
#In medicine sector both gender was shared equally ratio with nearly 50% in the same time – In the meantime, both genders shared/had an equal ratio, nearly 50%
#contras – contrast
#female contributed around 65% in history,and male was 10% higher than that – wrong infromation
#medicine shows similar ratio in both proporti – unclear
BAND – 5.0+
The bar chart demonstrates the ratio of men and woman academic staff members is different faculties of a particular university of the year 2008.
overall, men had recorted the highest in engineering , astronomy and science as opposed to woman who were the lowest. on the other hand men and woman almost similar in medicine .
In trems of engineering ratio of men was highest at 90%, while woman had only 10%. In the actronomy men was highest ratio 62% and woman only 27%. on the other hand men and woman almost similar in medicine it was ratio 49% and 50%.
in the arts woman was highest ratio 58% while men was ratio 45%. moreover, men was highest ratio 60% and woman was ratio 40% in the law. in the history woman was higher ratio 70% and man was lowest ratio was 25%. however un the science man was highest
#underlength
#work on capitalisation, spaces and punctuation
#body 2 – sentence making and structure
#recorted – recorded
#woman – women
#on the other hand – On the other hand(,)
#on the other hand men and woman almost similar in medicine – On the other hand, men and women were almost similar in medicine
#In trems of engineering – In terms of engineering(,)
# In the actronomy men was highest ratio 62% – In Astronomy, male employees had the highest ratio at 62%
#woman only 27% – wrong information
#men and woman almost similar in medicine it was ratio 49% and 50% – sentence making and structure
BAND – 5.0
The bar chart illustrates the proportion of male and female academic staff members in different faculties of a particular university in 2008.
overall, it is clear that male was the highest in Engineering while the lowest was female in the meantime. However, female was the highest in History while the male was the lowest in the meantime.
In Engineering, female had lowest academic staff in 10 percentage while male had academic staff was the highest percentage of 90.on the other hand, Astronomy sector was dominated by male with 62% and female was 35 percentage. Additionally, the history was the highest in female of 65% while the man had academic staff sectors in 25%.
On the other hand, Arts are considered less popular than others, where the percentage of female like tp do activity is just under 60%, which is more than that if girls, contributing 42%. conversely, the Medicine sector was some equally by female 55% and male 50%. In Science, male was the highest in 64% and female was the 35%. In terms or Law the female was the 40% which the male was the 60%.
#overview could be better (only pick keypoints)
#both body- sentence making and structure
#spelling mistake
#work on capitalisation and punctutaion
#it is clear that – unnecessary
#while the lowest was female in the meantime – (,) while the lowest was female/in the meantime female was the lowest
#academic staff in 10 percentage – sentence making
#male had academic staff was the highest percentage of 90 – male had academic staff was the highest percentage of 90
# the man had academic staff sectors in 25%. – wrong information
# female like tp do activity is just under 60% – wrong information
BAND – 4.5
The bar chart illustrates the percentage of men and women education staff members in different faculties of a particular university in the year of 2008.
Overall, the percentage of engineering was led by men, while women was the lowest . How ever the percentage of law was highest as men and the women was less then that.
In team of engineering, the percentage of men was the highest at 90%, while women and only 10 %. One the other hand, medicine sector was dominated by women 50% and men 5% less then that. In law the on ratio of women was 40% , and the men was 60 % .
In concern of science of more less then 80% of men , whereas the women was percentage of pf mo
#incomplete
#overview could be better (only pick keypoints)
#work on space
#avoid word splitting
#sentence making, structure and organisation
#How ever – However(,)
#team – terms
#and only 10 % – had only 10%
#then – than
#In law – In law(,)
#In concern of – avoid
BAND – 4.0
The picture illustrated data about the percentage of male and female education staff member in various type of a particular university in the year of 2008.
Overall ,the percentage of engineering was led by male ,While female was the lowest in female .However, the percentage of law was highest was male and the female was lass than that .
In terms of history the percentage of female was highest at 65% , While male had only 25% . Again the female was high percent pf arts ,While the male was less than that. In astronomy ,the ratio of male was approximately 62% and it was followed by female .
In concern of science of less than 80% of male ,Whereas the female was percentage of more than 20% . Moreover the male of high percentage of engin
#incomplete
#work on space before and after (.) and (,)
#overview could be better (only pick keypoints)
#picture illustrated – chart illustrates
#In terms of history – In terms of history(,)
#gain the female was high percent pf arts ,While the male was less than that – sentence making
#In concern of science – avoid
BAND – 4.5
The bar provides information about male and female academic staff members in different faculties of a particular university in 2008
overall the percentage of engineering executives was lead by males, while female was ate the top in arts and history however had equal proportion of male and female in the meantime
In terms of engineering the percentage of male was the highest at 90% while female had only 10% on the other hand history sector was dominated by female with 70% and male was half of less than that, In contrast of medicine was equally shared by male and female with 45% each , In law the ratio of male was approximately 60% and it was followed by female by 40%,
In science male was the highest by 65% and female was 35%
In astronomy the ratio of male was higher by 65% moreover female percentage was at astronom
#incompletely
#work on space, punctuation and capitalisation
#overall – Overall(,)
#was lead – was led
#was ate – unclear
#In terms of engineering – In terms of engineering(,)
#In contrast of medicine was equally – sentence making
#male was the highest by 65% – proportion of male was the highest at 65%
BAND – 6.0+ (work on space, punctuation and capitalisation to increase your band)