The pie chart below shows the main reasons why agricultural land becomes less productive. The table shows how these causes affected three regions of the world during the 1990s.
The pie chart below shows the main reasons why agricultural land becomes less productive. The table shows how these causes affected three regions of the world during the 1990s.
The pie chart illustrates the significant reasons of becoming less productive land for agriculture. The tables compares causes of the affected three regions of the would during the 1990s.
The highest ratio was over-cultivation of land and the least portions is other. A major difference is between North America and Oceania in total land degraded.
Regarding to over-grazing was 35% which was the highest ratio. This ratio was followed by deforastation with 35while other ratio was 7% less more than
The given pie chart compare why farmlands was become less productive for some causes, while table depicts how much consequence had been facing in three distinct areas ( North America, Europe and Oceania )in the 1990s.
Overall, most effective reason was over-grazing and deforestation due to these agricultural land became less productive; however, most of the land degradation affected in Oceania area by over-grazing compared to others regions.
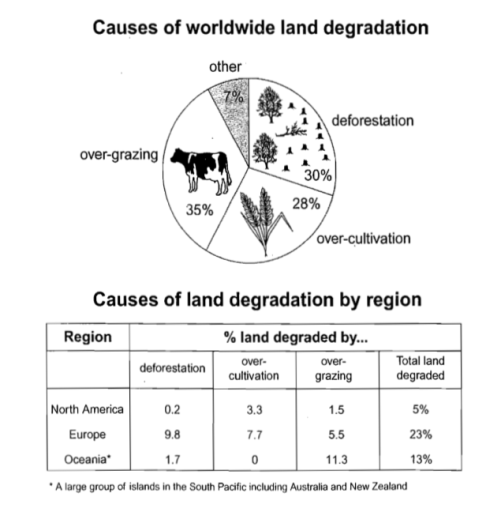
In terms of worldwide land degradation, the significant reason was overgrazing which was accounting for 35%, followed by deforestation and over cultivation, accounted for 30% to 28% respectively, while only 7% was for other reasons.
Regarding North American resident, deforestation affected o.2% , while 3.3% and 1.5% for over-grazing and cultivation respectively.
The pie chart compares the causes of worldwide land degradation, while the table illustrated how these reasons affected in three different territory in the decade of 1990s.
Overall, in pie chart over-grazing was the most reason of agriculture degradation, while other was least. Notably, Europe degraded the largest portion of land with most deforestation. Whereas, North America degraded least figure of land rather than other regions in over the time.
In terms of causes of land degradation, the most reason of land becomes less productive was over-grazing with 35%, which followed by deforestation and over-cultivation with approximately 30% and 28% respectively. Furthermore, just 7% of land degraded for other reason which was the least number of reason.
On the other hand, Europe degraded most number of land with total 23%, while almost 10% for deforestation which was the largest number. Similarly, 7.7% land degraded for over-cultivation and 5.5% for over-grazing in Europe. Moreover, Oceania was the second highest land degrader with total of 13%, whereas, 11.3% and 1.7% for over-grazing and deforestation respectively. By contrast, North America degraded jut 5% of land with just 0.2% (deforestation), 3.3%( over-cultivation) and just 1.5%( over-grazing).
The pie chart illustrate the causes of agricultural land becomes less productive, while the table chart compare how these reason affected the different regions in the decade of 1990s.
Overall, over-grazing is the most popular reason of worldwide land degradation, while other was lower. Notably, Europe degraded the highest portion of land and Oceania over-cultivation the lowest portion of land.
In terms of causes of worldwide land degradation, in the decade of 1990s the post popular causes is a over-grazing(35%), while the second highest portion is deforestation(30%). Followed by over-cultivation, which was almost 28%. In contrast, other was least preference approximately 7%.
Furthermore, the huge damage of land degradation was experienced on the Europe, reaching 23%. In addition, the Oceania experienced with 13%, but the over-cultivation did not exist anymore in this area. In contrast, the North America had the lowest percentages with only 5% in average.