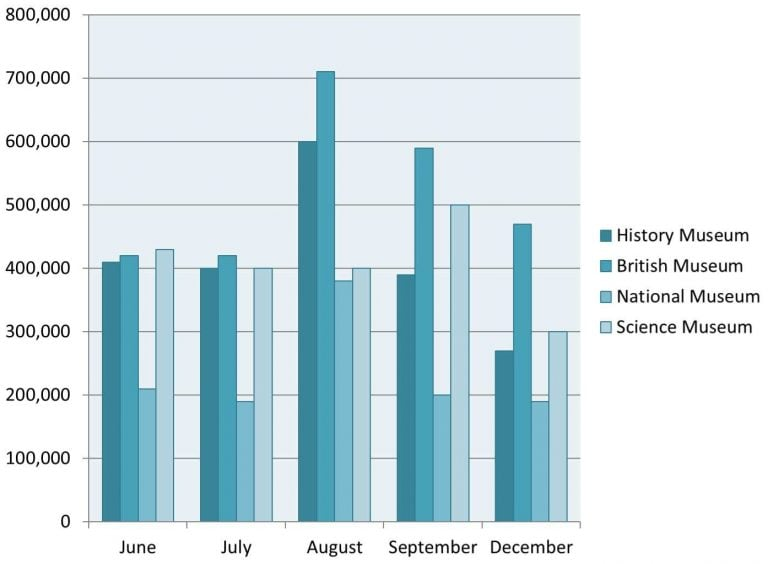
The bar chart shows the number of visitors to four London museumsin 2015.
Word Count: 0
Submitting...
7 thoughts on “w1 bar”
Masuma Akter
The given bar chart illustrates the amount of visitors in History museum, British museum, national museum and Science museum in United Kingdom from June to December during the year 2015.
overall, the number of visitors in British museum was the highest in all month except in June, while the National museum followed an oppossite trend throughout the period. Notably, Science museum visitors were a stable in July and August.
In terms of History museum, in July , it was around 410000 visitors then it increased highest portion and peck at 600000. After that it was repidlly dec
The given bar graph compares the number of traveler who visited in four different museums namely History Museum, British Museum, National Museum, Science Museum in distinct months in the UK in the year 2015.
Overall, the History Museum was most preferable to the visitor compared to other museum on August, while the least number of people went to Science Museum which showed an downward trend during all months.
From June to July , the number of people visited the science museum to around 420,000, followed by British museum and History museum was accounted for just over 40 thousand, while only about 210,000 was visited the National museum.
The bar chart compares the quantity of tourists to four distinct London museums namely- History, British, National, Science museums in the year of 2015.
Overall, the highest number of visitors preferred to visit to museums in August, while British museum had most visitors in this time of period. Notably, the number of visitors of Science museum were almost stable in every month.
In terms of History museum, it was almost stable in June and July with round 400,000 visitors, whereas it increased dramatically in august with approximately 600,000 visitors. Then, its decrease rapidly and reached at less than 300,000 in December. Moreover, British museum rose dramatically between June and August with 410,000 to 710,000 tourists respectively, while it fell significantly with less than 500,000 visitors in December.
On the other hand, the quantity of National museum visitors which was stable in every month with around 200,000 tourists except August, which surge rapidly with around 3800,00 tourists in this month. Furthermore, the figure of science museum tourists were showed an fluctuation trend. It start with about 420,000 visitors in June then it fell slightly in August with approximately 400,000. Then, it fluctuated between September and October with 500,000 and 300,000 tourists respectively.
the bar chart illustrates the figure of visitors in four distinct- history museum, British museum, national museum, science museum in London museums.
The largest figure of the tourists were history museum compared to other and the least number visitors of the figure was national museum. A similar figure of the tourist is seen in august in term of national museum.
In term of history, the number of the tourist was more than other museum with 700,000 in august this number is followed by september December
The bar chart compares the number of tourist visited to four different museums- History Museum, British Museum, National Museum and Science Museum in 2015.
Overall, The highest number of tourist visited in August with British Museum. However, History Museum was follow down trend. Notably, Nation museum was almost similar in each year.
To begin with, in June month, around 400000 people visited History, British and Science gallery . While, only 200000 tourists visited the National Museum. Similarly, in July few people liked to visit National art gallery rather than others. On contrary, the popularity of British museums increased dramatically from 400000 to 700000 which was also the highest number of tourists.
Moreover , in the month of September, people decreased to visit all museums .The figure showed the British Museum was a higher number of tourists and the science museums were less crowded. Furthermore, at the end of the year , the British Museum was famous while other museums were less than 300000 visitors visit.
the data depicts the amount of travelers visited four London museums in the year 2015.
overall, British museum was pre-dominant in the chart with the highest number of visitors, while, national museum had the lowest number of visitors during the period. Notably, science museum continuously lost their visitors over the chart.
The provided bar chart illustrates the figure of visitors to four the UK museums in the year of 2015.
Overall, the number of visitors ratio was significant in British Museum on August, while the least amount of National Museum except on August .Notably, the highlighting of all museums were major different in London.
To observing of details, the beginning month had History Museum with 400,000 and it was least in dece
The given bar chart illustrates the amount of visitors in History museum, British museum, national museum and Science museum in United Kingdom from June to December during the year 2015.
overall, the number of visitors in British museum was the highest in all month except in June, while the National museum followed an oppossite trend throughout the period. Notably, Science museum visitors were a stable in July and August.
In terms of History museum, in July , it was around 410000 visitors then it increased highest portion and peck at 600000. After that it was repidlly dec
The given bar graph compares the number of traveler who visited in four different museums namely History Museum, British Museum, National Museum, Science Museum in distinct months in the UK in the year 2015.
Overall, the History Museum was most preferable to the visitor compared to other museum on August, while the least number of people went to Science Museum which showed an downward trend during all months.
From June to July , the number of people visited the science museum to around 420,000, followed by British museum and History museum was accounted for just over 40 thousand, while only about 210,000 was visited the National museum.
The bar chart compares the quantity of tourists to four distinct London museums namely- History, British, National, Science museums in the year of 2015.
Overall, the highest number of visitors preferred to visit to museums in August, while British museum had most visitors in this time of period. Notably, the number of visitors of Science museum were almost stable in every month.
In terms of History museum, it was almost stable in June and July with round 400,000 visitors, whereas it increased dramatically in august with approximately 600,000 visitors. Then, its decrease rapidly and reached at less than 300,000 in December. Moreover, British museum rose dramatically between June and August with 410,000 to 710,000 tourists respectively, while it fell significantly with less than 500,000 visitors in December.
On the other hand, the quantity of National museum visitors which was stable in every month with around 200,000 tourists except August, which surge rapidly with around 3800,00 tourists in this month. Furthermore, the figure of science museum tourists were showed an fluctuation trend. It start with about 420,000 visitors in June then it fell slightly in August with approximately 400,000. Then, it fluctuated between September and October with 500,000 and 300,000 tourists respectively.
the bar chart illustrates the figure of visitors in four distinct- history museum, British museum, national museum, science museum in London museums.
The largest figure of the tourists were history museum compared to other and the least number visitors of the figure was national museum. A similar figure of the tourist is seen in august in term of national museum.
In term of history, the number of the tourist was more than other museum with 700,000 in august this number is followed by september December
The bar chart compares the number of tourist visited to four different museums- History Museum, British Museum, National Museum and Science Museum in 2015.
Overall, The highest number of tourist visited in August with British Museum. However, History Museum was follow down trend. Notably, Nation museum was almost similar in each year.
To begin with, in June month, around 400000 people visited History, British and Science gallery . While, only 200000 tourists visited the National Museum. Similarly, in July few people liked to visit National art gallery rather than others. On contrary, the popularity of British museums increased dramatically from 400000 to 700000 which was also the highest number of tourists.
Moreover , in the month of September, people decreased to visit all museums .The figure showed the British Museum was a higher number of tourists and the science museums were less crowded. Furthermore, at the end of the year , the British Museum was famous while other museums were less than 300000 visitors visit.
the data depicts the amount of travelers visited four London museums in the year 2015.
overall, British museum was pre-dominant in the chart with the highest number of visitors, while, national museum had the lowest number of visitors during the period. Notably, science museum continuously lost their visitors over the chart.
In terms of history museum,
The provided bar chart illustrates the figure of visitors to four the UK museums in the year of 2015.
Overall, the number of visitors ratio was significant in British Museum on August, while the least amount of National Museum except on August .Notably, the highlighting of all museums were major different in London.
To observing of details, the beginning month had History Museum with 400,000 and it was least in dece