This pie chart illustrate the expenditures of different house hold in two specific countries there are Japan and Malaysia in the year of 2010
overall , the pie chart shows us the average house hold spent in various major Categories , there are Housing ,Transport, food, Health care , Others goods and services . However, both pie chart explain that the most expensive expenditures in japan is Others goods and services which is about 29% and in Malaysia the highest expenditure is in health care about 34%.
In japan the pie chart shows that the lowest spending in house hold is health care which is around 6% . On the contrast the lowest expense in Malaysia is in health care which is about 3% . So the both countries spending in health care are the most less according to the other categories
the others category is Food it is about 24% in japan also 27% in Malaysia both the percentage are in the second largest. others two expenses like Housing and transport are following same orders which is around 21% and 20% . In addition Malaysia spent almost 10% and
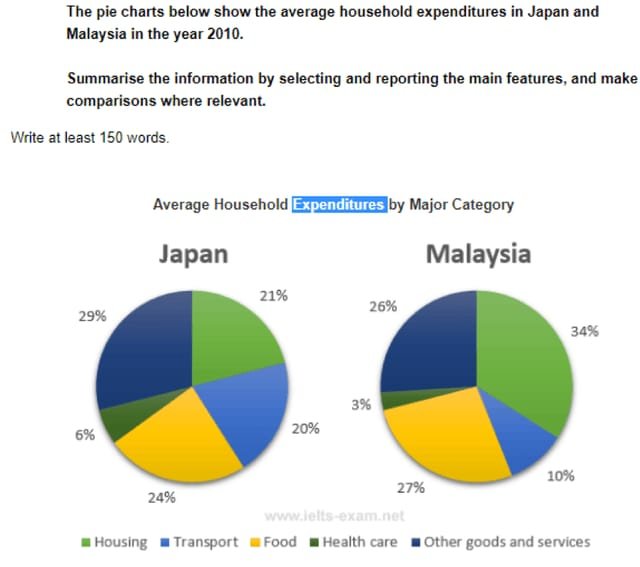
The pie charts illustrate the average household expenditure in two different nations namely- Japan and Malaysia in 2010.
Overall, Japan spends largest amount of money on other goods and services, while they spent less figure of money in healthcare. Notably, Malaysia has almost similar number of expenditures on food and other goods and services.
In terms of Japan, they spend highest money on other goods and services with 29%, which are followed by food with 24%. Additionally, the expenditure of transport and housing was almost same with 21% and 20% in housing and transport respectively. Moreover, Japan spent just 6% of money in healthcare which were the small cost rather than other categories.
Regards of Malaysia, they spent the greatest number of monies on housing with 34%. Whereas 27% and 26% of money spent on other goods and services and food respectively. Furthermore, they spend 10% in transport and just 3% in healthcare, which was less amount of expenditure from Malaysia.
**Japan spends largest amount of money – Japan spends the largest ratio of money #Article #word selection
**Malaysia has almost similar number of expenditures – Malaysia has almost similar portion of expenditures #word selection
**they spend highest money- they spend the highest money #Article
**which are followed by food with 24%.- which is followed by food with 24%. #Tense
**Japan spent just 6% of money in healthcare which were the small cost rather than other categories. – Japan spent just 6% of its money on healthcare, which was the smallest share among all categories.
**Regards of Malaysia, they spent the greatest number of monies on housing with 34%. – Regarding Malaysia, they spent the largest proportion on housing at 34%.
**Structues of ‘Whereas’ need 2 clauses
**Whereas 27% and 26% of money spent on other goods and services and food respectively- Whereas 27% and 26% of money were spent on other goods and services and food respectively.
**which was less amount of expenditure from Malaysia.-which was the least percentage of expenditure from Malaysia. #word selection
The data depict the regular expenses of households in the country Japan and Malaysia in 2010.
Overall, other goods and services leads the chart, while, health care had the least ratio in Japan. Notably, In Malaysia, housing was the pre-dominant with the highest ratio.
In terms of Japan, others goods and services had the highest ratio( 29%), followed by food (24%). There was a small difference of 1% between housing and transport. The lowest proportion of the chart was health care (6%).
With regard to Malaysia, housing was the pre-dominant with the highest ratio(34%), however, the least ratio(3%) of the chart was health care. The proportion of transport, food and other goods and services were 10%, 27% and 26%, respectively.
**The data depict -The data depicts #Word form
**expenses of households in the country Japan and Malaysia in 2010 – expenses of households in two countries -Japan and Malaysia- in 2010.
**no need to add punctuation after ‘while’ #punctuation
**There was a small difference of 1% between housing and transport- it is better to add the actual ratio of at least one feature.
**however, the least ratio(3%) of the chart was health care – however, the least ratio(3%) of the chart was in health care. #preposition
**has good command over structural variations but need to focus more on accuracy.
** the report contains more simple sentences than complex.
The data depict the regular households price in Japan and Malaysia in 2010.
overall, the largest amount of household expenses in Japan is housing .
and the lowest amount is heath care. On the another hand the highest amount in Malaysia is also housing and the lowest holds health care .
In Japan the percentage of other goods and services is quite similar to Malaysia. The diffrence between Japan and Malaysia in food is just 4% .
in addition heath care is almost same in both country which lowest. Transport is double in Japan than Malaysia .
In compared to Malaysia ,Japan holds less percentage in each section.
expect other goods and services .Housing is quite much better in Malaysia .The the percentage is not that high much from each other however its quite similar .
#The data depict- The data depicts **word form
#households price- households expenditure ** word selection
#Capitalisation # illogical paragraphing
#amount – portion
# the largest amount of household expenses in Japan is housing .
and the lowest amount is heath care- the largest ratio of household expenses in Japan is in housing .
and the lowest portion is in heath care
#In Japan the percentage of other goods and services is quite similar to Malaysia.- Mention the percentages for better clearity
#in addition heath care is almost same in both country which lowest. – In addition, heath care is almost same in both countries, which is the lowest. **Capitalisation **SVA **s.structure
#Transport is double in Japan than Malaysia – The percentage of transport was double in Japan than Malaysia . ** S.making
#In compared to Malaysia ,Japan holds less percentage in each section. – Compared to Malaysia, Japan held less percentage in each section. (Lack of data)
# There is no evidence of data in body paragraph 2 + unnecessary additional information.
The pie charts compares middle of residence who expense by different five categories ,namely ,housing ,transport, food , health care , and other goods and services in Japan and Malaysia from 2010.
Overall ,it is clear that in Japan and Malaysia was expense highest ratio between housing and food, meanwhile the health care were follow in both countries least portion except other categories ,in transportation and other goods and services expenditures were around similar position for both countries.
#The pie charts compares middle of residence who expense by different five categories – **S.making error – The pie chart compares the proportion of typical household spendings in five sectors namely-……. ….. ….. …..
#poor_paraphrasing
#Very poor overview
#need to work on sentence making
# incomplete
The pie charts compare the amount of money , which is spent to lead the house in two countries -Japan Malaysia in 2010.
overall, the largest numbers of money was spent regarding of housing whereas, the least portion were needed in health care .There is a similar percentage ,In the cases of food and other goods and services .
Regarding of Japan ,the most amount of money is given in other goods and services was 29% compared to others household. This portion was followed by housing and transport which were 21%and 20% respectively and between them was a difference with a 1%.inthe heath care ,6% is spent in Japan.
In the terms of Malaysia, the largest amount of money is spent housing which was 34%.Food and other goods and services were same were27% and 26%.
#The pie charts compare the amount of money – The pie charts compare the proportion of money ** Word selection
**Capitalisation
# the largest numbers of money was spent regarding of housing whereas, the least portion were needed in health care . – the largest percentage of money was spent on housing in Malaysia, whereas, the least portion was expended in health care in both nations.
~numbers – ratio ** Word selection **Word form
~need to add comma before and after ‘Whereas’.
~Do not add space before any punctuation.
#There is a similar percentage ,In the cases of food and other goods and services . -** Capitalisation **unnecessary punctuation
#Regarding of Japan – Regarding Japan
#lots of sentence structure mistakes
#add comma before ‘which’
This pie chart illustrate the expenditures of different house hold in two specific countries there are Japan and Malaysia in the year of 2010
overall , the pie chart shows us the average house hold spent in various major Categories , there are Housing ,Transport, food, Health care , Others goods and services . However, both pie chart explain that the most expensive expenditures in japan is Others goods and services which is about 29% and in Malaysia the highest expenditure is in health care about 34%.
In japan the pie chart shows that the lowest spending in house hold is health care which is around 6% . On the contrast the lowest expense in Malaysia is in health care which is about 3% . So the both countries spending in health care are the most less according to the other categories
the others category is Food it is about 24% in japan also 27% in Malaysia both the percentage are in the second largest. others two expenses like Housing and transport are following same orders which is around 21% and 20% . In addition Malaysia spent almost 10% and
# word_splitting (hold spent) # paraphrasing error in introduction #capitalisation # word form #word selection (Categories)
#poor overview # don’t include data in overview #wrong tense #punctuation #s.making error #preposition #incomplete sentence
Band- 5.0
Ask for feedback
The pie charts illustrate the average household expenditure in two different nations namely- Japan and Malaysia in 2010.
Overall, Japan spends largest amount of money on other goods and services, while they spent less figure of money in healthcare. Notably, Malaysia has almost similar number of expenditures on food and other goods and services.
In terms of Japan, they spend highest money on other goods and services with 29%, which are followed by food with 24%. Additionally, the expenditure of transport and housing was almost same with 21% and 20% in housing and transport respectively. Moreover, Japan spent just 6% of money in healthcare which were the small cost rather than other categories.
Regards of Malaysia, they spent the greatest number of monies on housing with 34%. Whereas 27% and 26% of money spent on other goods and services and food respectively. Furthermore, they spend 10% in transport and just 3% in healthcare, which was less amount of expenditure from Malaysia.
**Japan spends largest amount of money – Japan spends the largest ratio of money #Article #word selection
**Malaysia has almost similar number of expenditures – Malaysia has almost similar portion of expenditures #word selection
**they spend highest money- they spend the highest money #Article
**which are followed by food with 24%.- which is followed by food with 24%. #Tense
**Japan spent just 6% of money in healthcare which were the small cost rather than other categories. – Japan spent just 6% of its money on healthcare, which was the smallest share among all categories.
**Regards of Malaysia, they spent the greatest number of monies on housing with 34%. – Regarding Malaysia, they spent the largest proportion on housing at 34%.
**Structues of ‘Whereas’ need 2 clauses
**Whereas 27% and 26% of money spent on other goods and services and food respectively- Whereas 27% and 26% of money were spent on other goods and services and food respectively.
**which was less amount of expenditure from Malaysia.-which was the least percentage of expenditure from Malaysia. #word selection
Band 6.0
The data depict the regular expenses of households in the country Japan and Malaysia in 2010.
Overall, other goods and services leads the chart, while, health care had the least ratio in Japan. Notably, In Malaysia, housing was the pre-dominant with the highest ratio.
In terms of Japan, others goods and services had the highest ratio( 29%), followed by food (24%). There was a small difference of 1% between housing and transport. The lowest proportion of the chart was health care (6%).
With regard to Malaysia, housing was the pre-dominant with the highest ratio(34%), however, the least ratio(3%) of the chart was health care. The proportion of transport, food and other goods and services were 10%, 27% and 26%, respectively.
**The data depict -The data depicts #Word form
**expenses of households in the country Japan and Malaysia in 2010 – expenses of households in two countries -Japan and Malaysia- in 2010.
**no need to add punctuation after ‘while’ #punctuation
**There was a small difference of 1% between housing and transport- it is better to add the actual ratio of at least one feature.
**however, the least ratio(3%) of the chart was health care – however, the least ratio(3%) of the chart was in health care. #preposition
**has good command over structural variations but need to focus more on accuracy.
** the report contains more simple sentences than complex.
Band 6.0+
The data depict the regular households price in Japan and Malaysia in 2010.
overall, the largest amount of household expenses in Japan is housing .
and the lowest amount is heath care. On the another hand the highest amount in Malaysia is also housing and the lowest holds health care .
In Japan the percentage of other goods and services is quite similar to Malaysia. The diffrence between Japan and Malaysia in food is just 4% .
in addition heath care is almost same in both country which lowest. Transport is double in Japan than Malaysia .
In compared to Malaysia ,Japan holds less percentage in each section.
expect other goods and services .Housing is quite much better in Malaysia .The the percentage is not that high much from each other however its quite similar .
#The data depict- The data depicts **word form
#households price- households expenditure ** word selection
#Capitalisation # illogical paragraphing
#amount – portion
# the largest amount of household expenses in Japan is housing .
and the lowest amount is heath care- the largest ratio of household expenses in Japan is in housing .
and the lowest portion is in heath care
#In Japan the percentage of other goods and services is quite similar to Malaysia.- Mention the percentages for better clearity
#in addition heath care is almost same in both country which lowest. – In addition, heath care is almost same in both countries, which is the lowest. **Capitalisation **SVA **s.structure
#Transport is double in Japan than Malaysia – The percentage of transport was double in Japan than Malaysia . ** S.making
#In compared to Malaysia ,Japan holds less percentage in each section. – Compared to Malaysia, Japan held less percentage in each section. (Lack of data)
# There is no evidence of data in body paragraph 2 + unnecessary additional information.
Band 5.0
The pie charts compares middle of residence who expense by different five categories ,namely ,housing ,transport, food , health care , and other goods and services in Japan and Malaysia from 2010.
Overall ,it is clear that in Japan and Malaysia was expense highest ratio between housing and food, meanwhile the health care were follow in both countries least portion except other categories ,in transportation and other goods and services expenditures were around similar position for both countries.
I
#The pie charts compares middle of residence who expense by different five categories – **S.making error – The pie chart compares the proportion of typical household spendings in five sectors namely-……. ….. ….. …..
#poor_paraphrasing
#Very poor overview
#need to work on sentence making
# incomplete
Band 2.5
The pie charts compare the amount of money , which is spent to lead the house in two countries -Japan Malaysia in 2010.
overall, the largest numbers of money was spent regarding of housing whereas, the least portion were needed in health care .There is a similar percentage ,In the cases of food and other goods and services .
Regarding of Japan ,the most amount of money is given in other goods and services was 29% compared to others household. This portion was followed by housing and transport which were 21%and 20% respectively and between them was a difference with a 1%.inthe heath care ,6% is spent in Japan.
In the terms of Malaysia, the largest amount of money is spent housing which was 34%.Food and other goods and services were same were27% and 26%.
#The pie charts compare the amount of money – The pie charts compare the proportion of money ** Word selection
**Capitalisation
# the largest numbers of money was spent regarding of housing whereas, the least portion were needed in health care . – the largest percentage of money was spent on housing in Malaysia, whereas, the least portion was expended in health care in both nations.
~numbers – ratio ** Word selection **Word form
~need to add comma before and after ‘Whereas’.
~Do not add space before any punctuation.
#There is a similar percentage ,In the cases of food and other goods and services . -** Capitalisation **unnecessary punctuation
#Regarding of Japan – Regarding Japan
#lots of sentence structure mistakes
#add comma before ‘which’
Band 5.0