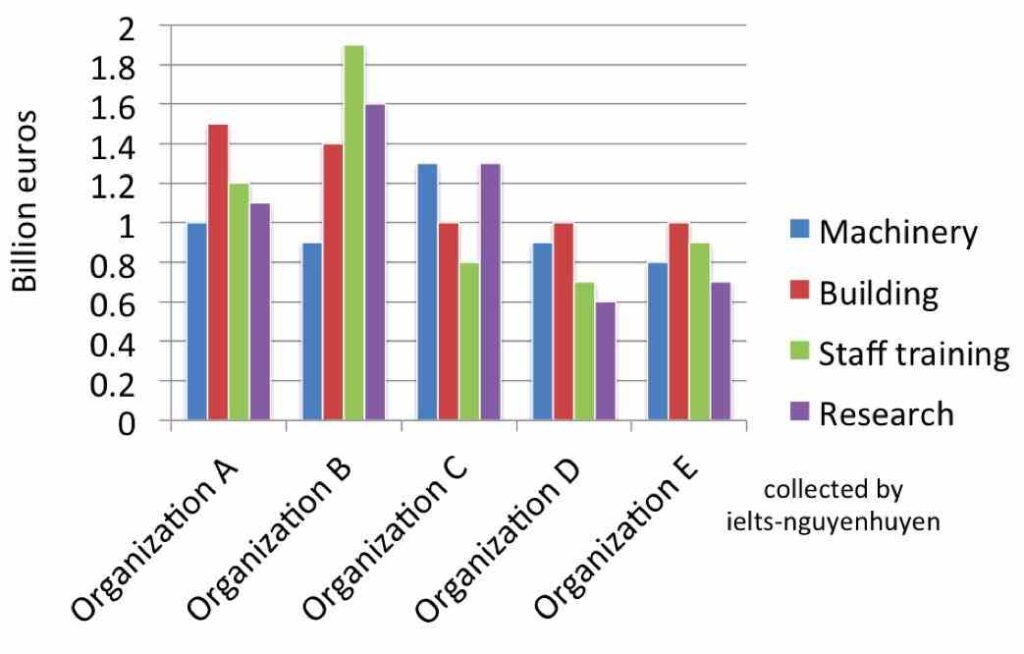
the bar chart below shows the amount of money invested in each category from five organizations
Word Count: 0
Submitting...
12 thoughts on “RICU bar”
Rimon Biswas
This graph illustrate five organization which has invested numbers amount of money in those categories are Machinery , Building , Staff training, Research.
overall, the highest amount of money has been invested in Staff training
at organization B. On the other hand the lowest number of money is invested in staff training are in organization D . Others categories like Machinery is the highest investment in organization A and also the lowest numbers of investment in Machinery is the same type of organization.
In Organization A this graph shows that the amount of investment between machinery and research also the staff training are following same number of ordered number just slightly different then each other’s . In the organization B the staff training is the highest of all other categories and the rest of others are marinating descending orders just slightly different than other
#This graph illustrate five organization – The graph illustrates information of five organizations ** Word Selection **Word form
#which has invested numbers amount of money in those categories are Machinery , Building , Staff training, Research. – which has invested money in 4 categories namely- Machinery , Building , Staff training, Research.
#need work on Paraphrasing
#overall – Capitalisation
#comma after On the other hand
# money is invested in staff training are in organization D – S. structure error
#Machinery is the highest investment in organization A – Machinery has the highest investment in organization A **S.structure error
#and also the lowest numbers of investment in Machinery is the same type of organization. **S.making error
#In Organization A this graph shows that the amount of investment between machinery and research also the staff training are following same number of ordered number just slightly different then each other’s – ****S.making error
#very poor body paragraph 2- lots of sentence making errors
The data illustrate the number of money invested in every section from five organizations.
Overall, the hightest number of money investment is in organization B. On the another hand the lowest amount of invested money in organization C .
The rage of buildings are similar in organization A and B .and the rest is same.The highest number of stuff training in organization B which considered as a largest amount . and the lowest amount of stuff training in organization D .
in terms of organizations ,organization D and E holds the same amount of buildings and others are quite diffrent . Machinary has the all average amountb of
#money invested in every section – Sector **Word selection
#On the another hand the lowest amount of invested money in organization C . **S.Structure **Punctuation – On the another hand, the lowest amount of money is invested in organization C.
~ Do not add Space before punctuations.
# No data presented
# irrelevant word choices ~ The rage of buildings are similar in organization A and B
#need to work on sentence making ~The highest number of stuff training in organization B which considered as a largest amount . and the lowest amount of stuff training in organization D .
# start the sentence with capital letter.
# last sentence of the report is incomlete.
The bar chart compares the figure of money invested in five distinct categories from five separate organizations.
Overall, organizations A and B invested most money on all categories rather than other organizations, while organization D and E spent less. Notably, organization E invested almost similar amount of money in all categories.
In terms of organization A, they spent most amount of money in building with around 1.5 billion euros, whereas approximately 1 billion euro spent on machinery which are lees from this organization. In addition, invest on research and staff training was almost similar, both are less than 1.2 billion euro.
Moreover, organization B shows a fluctuation trend in spending all categories, invested almost 1.9 billon euros on staff training which was largest figure. However, on machinery invested approximately 1.6 billion and 1.4 and 0.9 billion euros spend on building and research respectively. On the other hand, organization D and E spend almost similar figure of euros in all categories all were less than 1 billion euros.
# organizations A and B invested most money – organizations A and B invest most money **Word form
#while organization D and E spent less.- while organization D and E spend less. **Word form
#Notably, organization E invested almost similar amount of money in all categories. – invest **Word form
#Add comma before and after ‘Whereas’
#whereas approximately 1 billion euro spent on machinery (**Punctuation) which are lees(**Spelling) from this organization. (Unclear) **S.Structure – whereas, approximately 1 billion euro is spent on machinery.
#invest on research – **word form – investment on research
#invest on research and staff training was almost similar **Tense – invest on research and staff training are almost similar
#organization B shows a fluctuation trend in spending all categories – time fix data doesn’t show fluctuation trend. **wrong information
# invested almost 1.9 billon euros on staff training which was largest figure – It invests almost 1.9 billon euros on staff training, which is the largest figure. #punctuation # article # tense
#organization D and E spend almost similar figure of euros in all categories all were less than 1 billion euros. – **S.Structure – organization D and E spend almost similar figure of euros in all categories that are less than 1 billion euros.
The bar chart illustrates the percentage of money expense in each four different categories ,namely machinery,building,staff training,and research from five organizations. Overall,it is clear that organization B expenditures highest portion in staff training and research except those categories.however, a majority of portion invested in organization D and organization E both are stood almost similar positon . In terms of staff training, in organization B expense highest ratio 1.
# keep the introduction and overview in seperate paragraphs.
#it is clear that organization B expenditures highest portion in staff training and research except those categories – **s.making – it is clear that organization B spends the highest amount in staff training and research.
#Add a comma before and after ‘however’
#Do not add space before punctuation
however, a majority of portion invested in organization D and organization E both are stood almost similar positon – **S.making error
# In terms of staff training, in organization B expense highest ratio 1. – **S.making error **Wrong information
#incomplete report.
The bar illustrates the expenditure of money which is spent in four district sectors -Machinery, Building, Staff training, Research.
Most of the people spend money in staff training sector, whereas the least portion is expended in research .There is a similar numbers is seen in staff training and research in the terms of Organization D.
In terms of Machinery is the largest number of percentages in organization which is around 2 mi
#four district sectors – distinct **Word selection
#Most of the people – Most of the organisations **Word selection
# Most of the people spend money in staff training sector, whereas the least portion is expended in research .- **Wrong information
#Do not add space before any punctuation
#In terms of Machinery is the largest number of percentages in organization which is around 2 mi- **S.making
#incomplete report
The data depict the number of money which is invested in the individual classification from five different associations.
overall, staff training leads the chart with the highest number of money investment in organization B, followed by research. Notably, the similar number of money invested in organization D and E is quite similar.
In terms of organization A, building is the pre-dominant with the highest number of money(almost 1.5 billion euros), followed by staff training, research, and machinery with 1.2, 1.1, and 1 billion euros, respectively. The amount of money in building is similar in organization C, D and E.
With regard to organization B, the highest amount of money investment is sta
#The data depict – **Word form
#which is invested in the individual classification- **word selection – which is invested in individual sectors.
#Capitalistion
#staff training leads the chart with the highest number of money investment in organization B- **s.sturcture staff training leads the chart with the highest number of money invested by organization B
# the similar number of money invested in organization D and E is quite similar. – **s.making – the similar amount of money is invested by organization D and E.
#building is the pre-dominant with the highest number of money(almost 1.5 billion euros) – **S.making
#The amount of money in building is similar in organization C, D and E. – **s.making **word selection
#incomplete
This graph illustrate five organization which has invested numbers amount of money in those categories are Machinery , Building , Staff training, Research.
overall, the highest amount of money has been invested in Staff training
at organization B. On the other hand the lowest number of money is invested in staff training are in organization D . Others categories like Machinery is the highest investment in organization A and also the lowest numbers of investment in Machinery is the same type of organization.
In Organization A this graph shows that the amount of investment between machinery and research also the staff training are following same number of ordered number just slightly different then each other’s . In the organization B the staff training is the highest of all other categories and the rest of others are marinating descending orders just slightly different than other
#This graph illustrate five organization – The graph illustrates information of five organizations ** Word Selection **Word form
#which has invested numbers amount of money in those categories are Machinery , Building , Staff training, Research. – which has invested money in 4 categories namely- Machinery , Building , Staff training, Research.
#need work on Paraphrasing
#overall – Capitalisation
#comma after On the other hand
# money is invested in staff training are in organization D – S. structure error
#Machinery is the highest investment in organization A – Machinery has the highest investment in organization A **S.structure error
#and also the lowest numbers of investment in Machinery is the same type of organization. **S.making error
#In Organization A this graph shows that the amount of investment between machinery and research also the staff training are following same number of ordered number just slightly different then each other’s – ****S.making error
#very poor body paragraph 2- lots of sentence making errors
#no data presented.
Band 4.0
The data illustrate the number of money invested in every section from five organizations.
Overall, the hightest number of money investment is in organization B. On the another hand the lowest amount of invested money in organization C .
The rage of buildings are similar in organization A and B .and the rest is same.The highest number of stuff training in organization B which considered as a largest amount . and the lowest amount of stuff training in organization D .
in terms of organizations ,organization D and E holds the same amount of buildings and others are quite diffrent . Machinary has the all average amountb of
#money invested in every section – Sector **Word selection
#On the another hand the lowest amount of invested money in organization C . **S.Structure **Punctuation – On the another hand, the lowest amount of money is invested in organization C.
~ Do not add Space before punctuations.
# No data presented
# irrelevant word choices ~ The rage of buildings are similar in organization A and B
#need to work on sentence making ~The highest number of stuff training in organization B which considered as a largest amount . and the lowest amount of stuff training in organization D .
# start the sentence with capital letter.
# last sentence of the report is incomlete.
Band 4.0
The bar chart compares the figure of money invested in five distinct categories from five separate organizations.
Overall, organizations A and B invested most money on all categories rather than other organizations, while organization D and E spent less. Notably, organization E invested almost similar amount of money in all categories.
In terms of organization A, they spent most amount of money in building with around 1.5 billion euros, whereas approximately 1 billion euro spent on machinery which are lees from this organization. In addition, invest on research and staff training was almost similar, both are less than 1.2 billion euro.
Moreover, organization B shows a fluctuation trend in spending all categories, invested almost 1.9 billon euros on staff training which was largest figure. However, on machinery invested approximately 1.6 billion and 1.4 and 0.9 billion euros spend on building and research respectively. On the other hand, organization D and E spend almost similar figure of euros in all categories all were less than 1 billion euros.
# organizations A and B invested most money – organizations A and B invest most money **Word form
#while organization D and E spent less.- while organization D and E spend less. **Word form
#Notably, organization E invested almost similar amount of money in all categories. – invest **Word form
#Add comma before and after ‘Whereas’
#whereas approximately 1 billion euro spent on machinery (**Punctuation) which are lees(**Spelling) from this organization. (Unclear) **S.Structure – whereas, approximately 1 billion euro is spent on machinery.
#invest on research – **word form – investment on research
#invest on research and staff training was almost similar **Tense – invest on research and staff training are almost similar
#organization B shows a fluctuation trend in spending all categories – time fix data doesn’t show fluctuation trend. **wrong information
# invested almost 1.9 billon euros on staff training which was largest figure – It invests almost 1.9 billon euros on staff training, which is the largest figure. #punctuation # article # tense
#organization D and E spend almost similar figure of euros in all categories all were less than 1 billion euros. – **S.Structure – organization D and E spend almost similar figure of euros in all categories that are less than 1 billion euros.
Band 6.0+
The bar chart illustrates the percentage of money expense in each four different categories ,namely machinery,building,staff training,and research from five organizations. Overall,it is clear that organization B expenditures highest portion in staff training and research except those categories.however, a majority of portion invested in organization D and organization E both are stood almost similar positon . In terms of staff training, in organization B expense highest ratio 1.
# keep the introduction and overview in seperate paragraphs.
#it is clear that organization B expenditures highest portion in staff training and research except those categories – **s.making – it is clear that organization B spends the highest amount in staff training and research.
#Add a comma before and after ‘however’
#Do not add space before punctuation
however, a majority of portion invested in organization D and organization E both are stood almost similar positon – **S.making error
# In terms of staff training, in organization B expense highest ratio 1. – **S.making error **Wrong information
#incomplete report.
Band 3.0
The bar illustrates the expenditure of money which is spent in four district sectors -Machinery, Building, Staff training, Research.
Most of the people spend money in staff training sector, whereas the least portion is expended in research .There is a similar numbers is seen in staff training and research in the terms of Organization D.
In terms of Machinery is the largest number of percentages in organization which is around 2 mi
#four district sectors – distinct **Word selection
#Most of the people – Most of the organisations **Word selection
# Most of the people spend money in staff training sector, whereas the least portion is expended in research .- **Wrong information
#Do not add space before any punctuation
#In terms of Machinery is the largest number of percentages in organization which is around 2 mi- **S.making
#incomplete report
Band 2.5
The data depict the number of money which is invested in the individual classification from five different associations.
overall, staff training leads the chart with the highest number of money investment in organization B, followed by research. Notably, the similar number of money invested in organization D and E is quite similar.
In terms of organization A, building is the pre-dominant with the highest number of money(almost 1.5 billion euros), followed by staff training, research, and machinery with 1.2, 1.1, and 1 billion euros, respectively. The amount of money in building is similar in organization C, D and E.
With regard to organization B, the highest amount of money investment is sta
#The data depict – **Word form
#which is invested in the individual classification- **word selection – which is invested in individual sectors.
#Capitalistion
#staff training leads the chart with the highest number of money investment in organization B- **s.sturcture staff training leads the chart with the highest number of money invested by organization B
# the similar number of money invested in organization D and E is quite similar. – **s.making – the similar amount of money is invested by organization D and E.
#building is the pre-dominant with the highest number of money(almost 1.5 billion euros) – **S.making
#The amount of money in building is similar in organization C, D and E. – **s.making **word selection
#incomplete
Band 4.0