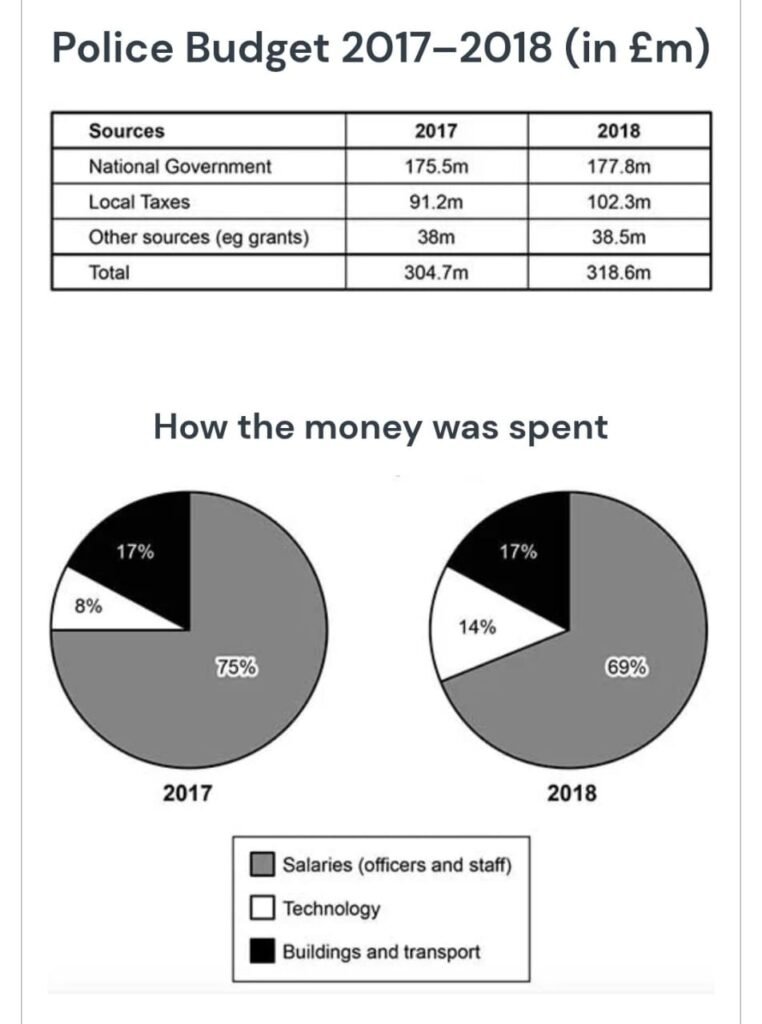
The table and charts below give information on the police budget for 2017 & 2018 in one area of Britain. The table shows where the money came from and the chart show how it was distributed
The table and charts below give information on the police budget for 2017 & 2018 in one area of Britain. The table shows where the money came from and the chart show how it was distributed
The table provide information on the police budget between 2017 and 2018 in one area of Britain, while the pie chart illustrate where the money came from and the chart show how it was distributed
overall, the total police budget increased with of National government begin the bigest funder in both year . In trams of expenditure ,salcompeer to other . on the other hand
The table illustrate the various information on the police budget for 2017 and 2018 in one area of Britain, While the per chart depicts this found distribute in different sector .
Overall, the total police budget was increased in 2018 total budget published in highest amount on total than other regions, while in 2018 and 2017, the total highest in both (Salaries and staff).
In terms of Police Budget highest source in National Government in th
The table illustrates information about police budget in Britain from 2017 to 2018, while the pie chart depicts this found distribute in different sector.
overall ,the total police budget was increased in 2018 total budget published in highest amount on total than other regions, while in 2018 Building and transport had the highest amount distribute this item .
In terms of police budget total had the most expenditure of money which was 318.6meters ,this chart second had mo
The table chart shows the various information of the police budget for 2017 and 2018 in area of Britain , while the pie chart indicates how the amount was spent.
overall, national government was high millions consume of this table of the both years. salaries was the supreme rate of this chart like officers and staff.
In terms of police budget , in (2017-2018) the highest amount was national government , which stood at 175.5 in 2017 and 177.8 in 2018.
it followed by local taxes at 91.2 and 102.3 respectively in the both year . other source was very near in this graph.
in respect of salaries , both year , salaries was highest rate of this graph , at 75%69% . building and transport was full similar . the least of this graph was technology in both chart , it was just 8% and !3
The table illustrates information no the police budget 2017and2018 ,while the pie chat illustrates where the money came from and the chat show how it was distributed
Overall, the total police budget increased slightly from 2017 to 2018 most of the funding came from the national government in both year sources accounted for the highest prop
The table illustrate how give information on the police budget between 2017 to 2018 one are of Britain.
Overall, the table shows police budget the highest source were the Total ,while how the money was spent had the highest salaries and Technology were the lowest.
In terms of in 2017 to 2018 much more Total in 304.7m and 318.6m in the police budget . while National Government were 175.5m and 177.8m in two times. In contrast, in 2017 to 2018 police budge on 91.2m 102, which the lowest were the other sources only 38m in two times .
on
The table illustrate the data of police budget one area of Britain ,While the table compares the money came from and the pie charts shows how was it distributed between 2017 and 2018.
Overall, national government was the highest amount of money spend in 2018 , while the salaries was spent around 75% which was top of the list, however, others sources of 38 millions was least of the table and buildings or transport was spent around 17% in 2017 to 2018 .
Moreover, national government police budget and spent money was noticeably quite similar .
Regarding, the national government was the higher amount of 1.77.8 millions in 2018 while the lowest amount of police budget was spending on other sources which was 38 millions . Moreover, the local taxes was in 2018 are around 102.3 million except 2017 was least of the amop
The table illustrate how police get money ,while the charts illustrate how money distribute for them in 2017 and 2018.
Overall, on National Government the highest amount of money was budget in 2018.Only 38 million budget for other sources in 2017.
Both 2017 and 2018 highest percentage of money was spend on salaries.
In trams of budget, government gave most budget for national government in both year , it is around 175.5 and 177.8.
The table provide information on the police budget between in of the year 2017 and 2018 in one area of Britain, while the pie chart illustrate where the money came from and the chart show how it was distributed
Overall, the total police budget increased slightly from 2017 to 2018. Most of the funding came from the national government in both year .Salaries accounted for the highest proportion in of spending. Although this fall in 2018 ,while spending on technology increased .
In 2017, the total budget 304.7m
The bar chart illustrates provide information about the police budget in one area of Britain in 2017 and 2018. The table shows the sources of money, while the pie chart illustrates how the was spend in both years.
overall, the total police budget increased slightly from 2017 to 2018. Most of the funding came from the national government in both years. Salaries accounted for the highest proportion of spending. Although this share fall in 2018, while spending on technology increased.
in 2017, the total budget was 304.7 million, rising to 318.6m in 2018. national goverment
The table shows the police budget in one area of Britain, while the pie charts illustrates how much money spent on three sources between 2018 to 2018.
Overall, the most significant amount came from national government and the least amount was other sources, while a noticeable amount spent on salaries (office and staff). In addition, the amount of building and transport remained unchanged in 2017 to 2018.
In terms of police budget, the amount of national government was 175.5m in the year of 2017, whereas it increased almost 3 millions. In the year of 2017, local tax amount was 91.2m which
the table chart shows from where the money come while pie chart show how it was distributed.
overall, the police budget in this area Britain increased slightly from euro 304.7m in 2017 to euro 318.6m in 2018 where, most of the funding came from same source which was national government while, salaries of officers and staff has the most significant figure in both year which were 75% and 69% respectively.
In term of table, the table shows that in both 2017 and 2018, the national government provided the highest amount of funding in police budget which was folllowed by Local taxes. Rising slightly from 175m to 177m.
Regarding pie chart, The largest amount of money was spent on salaries of officers and staff while builfing and
The table illustrate the main source of police budget and the pie chart depict how this fund distribute in different sector.
Overall, in 2018 total budget was greater than that of 2017 total budget ,while national government is the highest in the year of 2018.In addition, largest proportion of money was spent in salaries.
In 2017, greatest amount of money came from national government ,which was 175.5m,while local taxes followed by this amount. However
The table and pie chart illustrates that informatoin on the police cost for two year the money came from and charts distributed in the year 2017 and 2018 Britain.
overall,The police budget in total is the highest rates in both year,the following rates in national government is second highest rate.While the lowest rates in other sources.On the other side,salaries are the highest percentage in both year.While the lowest percentage in techonology.
In 2017 & 2018 ,The police budget in total is the highest rates in 304.7m and 318.6m. The following rates in national government is 175.5
m and 177.8m
The table and chart illustrates the information on the police budget where the money came and how it was distributed for 2017 & 2018 in one area of Britain.
Overall, the highest budget was came from National Government in 2018 and the lowest budget was came from other sources in 2017. The highest amount of money was spent for salaries in both year.
The highest budget was came from national government in 2018 it was 177.8m and local taxes was 102.3m. The second highest budget was came from also national government in 2017 it was 175.5m and local taxes was 91.2m.The budget of other sources was same in both year.
in