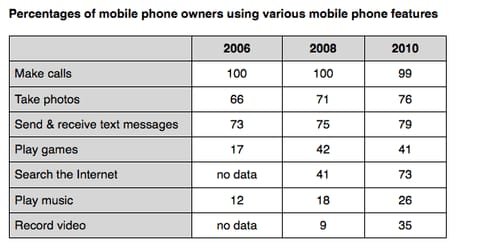
The table illustrates the percentages of mobile phone owners who using various mobile phone features between 2006 and 2010.
overall, play games witnessed a upward trend compared to others, while in make calls there was slight drop can observe. Notably, making calls in unchanged and end of the periods there was a slight drop can observed.
in terms of using mobile features, send & receive text massages increased slightly from 73 to 79 between 2006 and 2010. Similarly, take photos rose minimally from 66 to 76 between 2006
The table chart depicts the proportion of mobile phone owners using different mobile phone features between 2006 and 2010.
Overall, percentages of mobile phone using make calls was significant rise over the period, while record video was decline in the year. However, take photos and send & receive text messages similarly were minimal difference.
In terms of make calls the percentages of mobile phone similarly with 100% from 2006 to 2008, and decline in 2010 with 99%. Send & receive text messages was slightly increase at 73%, 75% and 79% over the period. In addition, take photos the portion of owners using 66% in 2006, there was a rise significantly in 2008 with 71% and 76% in 2010 respective;ly
The table chart shows the percentages of mobile phone owners using different mobile phone features in the years .
overall, the make calls are largest percentage of 100 , 100 in the two years , as well as , the record video using are lowest ratio of 9 percent in the year.
In terms of ,the using take photos and send and receive text messages are to similar in the three years. while, search the internet and record video in 2006 year to similar features . moreover, the percentage of us
The table illustrates the proportion of mobile phone owners used several mobile phone features in the years 2006,2008 and 2010.
Overall,maked calls by mobile phone showed upward trend over the period,while the least number of people used mobile phone for playing music.However ,mobile phone woners used mobile phone in send and receive text messages almost similar during the period.
In 2006, most of the owners used mobile phone for making calls and send and receive text messages at 100%,73% respectively.For taking photos at 66 % ,which increased 715 In 2008
the table chart compare mobile phone using percentages
overall, in tarems mobile play games noited signifficentlly rise compaer to others , while record video has lowest data however makes call remain unchenged at 2006 to 2008
regarding to the mobile using ratio of play games had noticeablelly rise in 2006 17 in 2008 42 and 20010 41 ,after that slight down at accoding to take photos slightly rise 66 to 76 between 206 to 2010
according to send and receive text massages start was 73 to 79 from 2006 to 20010 theres play music likey rise to 12 to 26
the table chart compare of mobile phone using percentage.
overall, in terms of using mobile phnoe of play games noted significant rise compare to others,while record video had lowest percentage ,however make calls was remain unchanged at 2006 to 2008.
regarding the monile phone using ratio of play games had notiaceable rise at 17 to 41 in 2006 and 2010.whereas, make calls was remaind unchanged from 2006 to 2010 and after that slight down at 1.accounted for take photos markedly increasing from 66 to 76 between 2006 and 2010.
according to send and text message stared was 73 and 79 from 2006 to 2010 .there was a play music moderately grew with 12 to26 after four years.between 2006 and 2010 mobile using ratio recored video at 9 to 35 and it was dramaticly rise in 2008 to 2010.accounted for search the internet enourmous growth at 41 to 73 during the two years.
The table illustrates the proportion of mobile phone users different purpose of using mobile phone features.
Overall, making calls witnessed an upward trend among seven features while play music experienced a downward trend. However, send and receive text messages remained similar during five years period.
The table chart illustrates the proportion of mobile phone owners using several cell phone features from 2006 to 2010.
Overall, for making calls experienced the highest proportion during this period, while recording video showed the lowest portion. However, for searching the internet and recording music witnessed no data in the same year.
In terms of making calls, in 2006, it showed 100%, which is considered as the largest one, while in 2008, it remained unchanged, and in 2008 it had a slight changed only 1%, less than that. Taking calls in 2006, it experienced 66% of the percentage, whereas it increased 10%, in 2010. Again by sending & receiving text message showed almost equal quantities over the period.
Regarding the playing games, it witnessed a minimal portion in 2006, and showed only 12% in 2006, while in 2008, it had significant increased 14% during the period. At the last phase of table, recording video witnessed no data in 2006, but it had significant rise with 35% in 2010.
Tahmid ahmed ( sir amar agor ekta hat lagia gese gia ota pore leksi)
The table illustrates the percentages of mobile phone owners who using various mobile phone features between 2006 and 2010.
overall, play games witnessed a upward trend compared to others, while in make calls there was slight drop can observe. Notably, making calls in unchanged and end of the periods there was a slight drop can observed.
in terms of using mobile features, send & receive text massages increased slightly from 73 to 79 between 2006 and 2010. Similarly, take photos rose minimally from 66 to 76 between 2006 and 2010. between 2006 to 2010 play music boosted significantly from 12 to 26. Moreover, recorded video increased noticeably from 9 to 35 between 2008 and 2010.
However, make calls is unchanged and accounted for 100 between 2006 and 2008, than there was a minimal fall between 100 to 99 in last two year. In addition, search the internet users increased dramatically from 41 to 73 between 2008 and 2010. Play games was rise noticeable from 17
The table illustrates the percentages of mobile phone owners who using various mobile phone features between 2006 and 2010.
overall, play games witnessed a upward trend compared to others, while in make calls there was slight drop can observe. Notably, making calls in unchanged and end of the periods there was a slight drop can observed.
in terms of using mobile features, send & receive text massages increased slightly from 73 to 79 between 2006 and 2010. Similarly, take photos rose minimally from 66 to 76 between 2006
The table chart depicts the proportion of mobile phone owners using different mobile phone features between 2006 and 2010.
Overall, percentages of mobile phone using make calls was significant rise over the period, while record video was decline in the year. However, take photos and send & receive text messages similarly were minimal difference.
In terms of make calls the percentages of mobile phone similarly with 100% from 2006 to 2008, and decline in 2010 with 99%. Send & receive text messages was slightly increase at 73%, 75% and 79% over the period. In addition, take photos the portion of owners using 66% in 2006, there was a rise significantly in 2008 with 71% and 76% in 2010 respective;ly
The table chart shows the percentages of mobile phone owners using different mobile phone features in the years .
overall, the make calls are largest percentage of 100 , 100 in the two years , as well as , the record video using are lowest ratio of 9 percent in the year.
In terms of ,the using take photos and send and receive text messages are to similar in the three years. while, search the internet and record video in 2006 year to similar features . moreover, the percentage of us
The table illustrates the proportion of mobile phone owners used several mobile phone features in the years 2006,2008 and 2010.
Overall,maked calls by mobile phone showed upward trend over the period,while the least number of people used mobile phone for playing music.However ,mobile phone woners used mobile phone in send and receive text messages almost similar during the period.
In 2006, most of the owners used mobile phone for making calls and send and receive text messages at 100%,73% respectively.For taking photos at 66 % ,which increased 715 In 2008
the table chart compare mobile phone using percentages
overall, in tarems mobile play games noited signifficentlly rise compaer to others , while record video has lowest data however makes call remain unchenged at 2006 to 2008
regarding to the mobile using ratio of play games had noticeablelly rise in 2006 17 in 2008 42 and 20010 41 ,after that slight down at accoding to take photos slightly rise 66 to 76 between 206 to 2010
according to send and receive text massages start was 73 to 79 from 2006 to 20010 theres play music likey rise to 12 to 26
the table chart compare of mobile phone using percentage.
overall, in terms of using mobile phnoe of play games noted significant rise compare to others,while record video had lowest percentage ,however make calls was remain unchanged at 2006 to 2008.
regarding the monile phone using ratio of play games had notiaceable rise at 17 to 41 in 2006 and 2010.whereas, make calls was remaind unchanged from 2006 to 2010 and after that slight down at 1.accounted for take photos markedly increasing from 66 to 76 between 2006 and 2010.
according to send and text message stared was 73 and 79 from 2006 to 2010 .there was a play music moderately grew with 12 to26 after four years.between 2006 and 2010 mobile using ratio recored video at 9 to 35 and it was dramaticly rise in 2008 to 2010.accounted for search the internet enourmous growth at 41 to 73 during the two years.
The table illustrates the proportion of mobile phone users different purpose of using mobile phone features.
Overall, making calls witnessed an upward trend among seven features while play music experienced a downward trend. However, send and receive text messages remained similar during five years period.
The table chart illustrates the proportion of mobile phone owners using several cell phone features from 2006 to 2010.
Overall, for making calls experienced the highest proportion during this period, while recording video showed the lowest portion. However, for searching the internet and recording music witnessed no data in the same year.
In terms of making calls, in 2006, it showed 100%, which is considered as the largest one, while in 2008, it remained unchanged, and in 2008 it had a slight changed only 1%, less than that. Taking calls in 2006, it experienced 66% of the percentage, whereas it increased 10%, in 2010. Again by sending & receiving text message showed almost equal quantities over the period.
Regarding the playing games, it witnessed a minimal portion in 2006, and showed only 12% in 2006, while in 2008, it had significant increased 14% during the period. At the last phase of table, recording video witnessed no data in 2006, but it had significant rise with 35% in 2010.
The table illustrates the percentages of mobile phone owners who using various mobile phone features between 2006 and 2010.
overall, play games witnessed a upward trend compared to others, while in make calls there was slight drop can observe. Notably, making calls in unchanged and end of the periods there was a slight drop can observed.
in terms of using mobile features, send & receive text massages increased slightly from 73 to 79 between 2006 and 2010. Similarly, take photos rose minimally from 66 to 76 between 2006 and 2010. between 2006 to 2010 play music boosted significantly from 12 to 26. Moreover, recorded video increased noticeably from 9 to 35 between 2008 and 2010.
However, make calls is unchanged and accounted for 100 between 2006 and 2008, than there was a minimal fall between 100 to 99 in last two year. In addition, search the internet users increased dramatically from 41 to 73 between 2008 and 2010. Play games was rise noticeable from 17