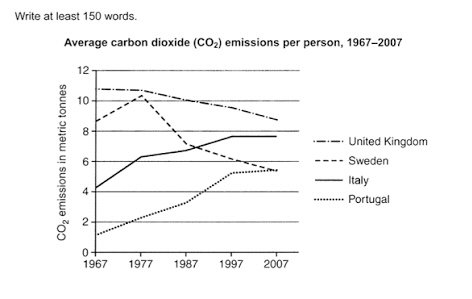
The graph below shows average carbon dioxide emissions per person in four counters from 1967 to 2007.
Summarise the information by selecting and reporting the main features and make comparisons where relevant.
The graph below shows average carbon dioxide emissions per person in four counters from 1967 to 2007.
Summarise the information by selecting and reporting the main features and make comparisons where relevant.
The graph beneath displays average carbon dioxide emissions per person in various countries from 1967 to 2007.
Overall, from 1967 to 2007 , Portugal experienced an upward trend followed by Italy . On the other hand , Sweden and the United kingdom experienced an downward trend .
It is clear that , in Portugal ,from 1967 to 2007 the number of people increased from 1 to 5 , which was an growth. In Italy , similarly to Portugal , the rising number of people was increasing , which was 4 to 7 people . Both of the countries had a growth on number of people , even though for Portugal it was a slow growth and for Italy it was an rapid growth from 1967 to 1977 then it was kind of stable , afterwards it was fully stable from 1997 to 2007.
In Sweden and the United kingdom , both of the countries experienced an decline trend , for Sweden firstly it was an upward trend from 1967 to 1977 then it was an rapid fall afterwards it was falling slowly. In the united kingdom , the number of people was declining slowly from 1967 to 2007 , there was nothing shocking about the fall cause it experienced an slow downward trend , so it was nothing unexpected .
Overview: Avoid mentioning years. The main trend is missing.
Body:
– failed to mention precise data (data mentioned in tonnes)
– sentence making errors
– Sentence structures are wrong
-Most of the sentences in body 1 are incorrect
-task not achieved fully
Band: 4.5
The graph chart shows average carbon dioxide emissions per person in four different countries from 1967 to in the year 2007.
It is clear that, the number of carbon dioxide emissions increased in Portugal and Italy. However, in in the chart the number of carbon emissions decreased in United kingdom and Sweden.
Between 1967 and 1977, the number of carbon dioxide emissions rapidly increased in Portugal, while In Italy the number of emissions increased dramatically. On the other hand, the number of CO2 emission increased extensively between 1977 and 2007, while In Italy the number of carbon dioxide grew unexpectedly.
Between 1967 and 1977, the number of carbon dioxide emissions grew rapidly in Sweden. However, In United Kingdom emissions decreased slowly between 1967 and 1977.On the other hand, In the year 1967 to 2007,the number of emissions had an unexpected decrease, at the same time the number of carbon dioxide emissions decreased dramatically.
in in the chart = comma missing
Overview: Main trend missing
Body 1: no data mentioned,
Wrong word: extensively* = significantly
No data is mentioned in the two bodies.
You should have provided data.
Band: 5.0
The line graph illustrate the number of carbon dioxide per person in four different countries over a five year period from 1967 to 2027.
overall, Italy and Portugal in two different countries are number of carbon emissions experienced an upward trend .Other two different countries United kingdom and Sweden are number of carbon emissions experienced an decline during this period.
In detail, there was a steady growth from Portugal. the figure showed a slight increase, followed by a sharp rise in Italy. there was a steady growth from 1967 to 2007. which was then followed by a significantly jump in Portugal. this period marked the most rapid increased on the graph.
Additionally, After peaking in Sweden, the figure declined steadily to reach its dramatically, hitting a low in crossed to Portugal. United kingdom, the trend showed a marked and consistent decreased . there are two different countries United kingdom and Sweden are carbon emissions in downward trend.
SVA: illustrate = illustrates*
Capitalization: overall = Overall*
Sentence making: Italy and Portugal had witnessed an upward trend, while the amount of carbon emissions declined in the UK and Sweden.
Most of the sentences are incorrect.
The writer has not mentioned any data from the chart.
Frequent sentence-making errors.
Band: 4.5
The line graph illustrates average carbon dioxide emissions for every single person in four different countries between 1967 and 2007 .
Overall, Italy and Portugal, both experienced an upward trend in the line chart, while United Kingdom and Sweden had a fall . In 1977, every country recorded a bit of increasing, except United Kingdom.
In perspective of increasing, Italy had a wisely increasing speed with a growth from nearly 4 to under 8 metric tones, whereas it was a stable condition in last 10 year (1997-2007). Surprisingly, Italy had followed by Portugal, where it made a rise from under 2 to under 6 metric tones.
On the other had, in decreasing the average emissions, Sweden had a quite surprised action of decreasing, while they made an upward trend from 1967, but in a sudden time, their average emission had fall from over 10 to under 6, what was in the period of 1977 to 2007. Significantly, United Kingdom run behind Sweden in the basis of decreasing, while it stabled in 1967 to 1977, and had a fall from just over 10 to over 8 metric tones.
– The overview should be more organized.
– Avoid mentioning years in the overview.
– it was a = it was stable*
– Italy had followed = Italy was followed by
– avoid followed by structure in time change graph
– unusual and informal sentence structures in body 2
– most of the structures failed to describe the precise data.
Band: 5.5
The line graph illustrates the percentage of carbon dioxide emissions each people in UK, Sweden, Italy, Portugal between 1967 and 2007.
It is clear that, The number of carbon dioxide emissions increased on Portugal and Italy. On the other hand, at this time United Kingdom and Sweden was decreased. Additionally, United Kingdom always higher then others.
Starting at 1 metric tones in 1996, the amount of carbon dioxide emission significantly rose at 5 metric tones in 1997, the it was stable at almost 5 metric tones between 1997 and 2007. In contrast, Between 1967 and 1977, the percentage of carbon dioxide dramatically upward trend from just over 4 metric tones to just over 6 metric tones, then the Italy slightly growth from almost 6 metric tones to approximately 8 metric tones between 1977 and 1997, that was static at under 8 metric tones from 1997 to 2007.
However, the amount of carbon dioxide emissions was 11 metric tones in United Kingdom in 1967, which was stable to 1977, the this trend rapidly downward trend from 11 metric tones to almost 9 metric tones. Moreover, in 1967 at 9 metric tones, the carbon dioxide sharply increased just over 10 metric tones in 1977, this figure significantly decreased from over 10 metric tones to aroun 5 metric tones between 1977 and 2007.
Here are the things you should work on……
1. “percentage of carbon dioxide emissions each people” → “amount of carbon dioxide emissions per person”
2. “in UK, Sweden, Italy, Portugal” → “in the UK, Sweden, Italy, and Portugal”
3. Unnecessary comma after “It is clear that,” → remove the comma
4. “The number of carbon dioxide emissions” → “The amount of carbon dioxide emissions”
5. “increased on Portugal and Italy” → “increased in Portugal and Italy”
6. “at this time United Kingdom and Sweden was decreased” → “during this period, the United Kingdom and Sweden decreased”
7. “United Kingdom always higher then others” → “the United Kingdom was always higher than the others”
8. “Starting at 1 metric tones in 1996” → “Starting at 1 metric ton in 1967”
9. “the amount of carbon dioxide emission significantly rose at 5 metric tones in 1997” → “the amount of carbon dioxide emissions rose significantly to 5 metric tons in 1997”
10. “the it was stable” → “then it was stable”
11. “metric tones” → “metric tons” (spelling)
12. “Between 1967 and 1977, the percentage of carbon dioxide dramatically upward trend” → “Between 1967 and 1977, the figure for carbon dioxide showed a dramatic upward trend”
13. “then the Italy slightly growth” → “then Italy grew slightly”
14. “that was static at under 8 metric tones” → “which remained steady at under 8 metric tons”
15. “the amount of carbon dioxide emissions was 11 metric tones in United Kingdom” → “the amount of carbon dioxide emissions in the United Kingdom was 11 metric tons”
16. “which was stable to 1977” → “which remained stable until 1977”
17. “the this trend rapidly downward trend” → “then this trend showed a rapid downward movement” or “then it declined rapidly”
18. “Moreover, in 1967 at 9 metric tones, the carbon dioxide sharply increased just over 10 metric tones” → “Moreover, in 1967, at 9 metric tons, carbon dioxide emissions in Sweden increased sharply to just over 10 metric tons”
19. “this figure significantly decreased from over 10 metric tones to aroun 5 metric tones” → “this figure decreased significantly from over 10 metric tons to around 5 metric tons”
20. Missing commas after linking words (“However,” “Moreover,” “In contrast,”) → Add commas after these words
21. Inconsistent capitalization (e.g., “United Kingdom”, “Italy”, “Portugal”) → Ensure all country names are capitalized consistently
The line graph presents average carbon dioxide emissions per individual in four different nations from year 1967 to 2007.
Overall, Portugal experience an upward trend in carbon dioxide emission, while the UK experience a down ward trend. However, carbon dioxide emission experience a fall in Sweden from 1977 to 2007, whereas Italy stayed stable in last 10 years.
In terms 0f Portugal, between 1967 and 1997 the number of (CO2) emission increased dramatically from approximately 1 to 5, however, it grow gently in last 10 year. In contrast, the number of carbon dioxide emission rise noticeably in Portugal from from 4 to 6 between 1967 and 1977, while between 1977 and 1997 the number of carbon dioxide emission had an quick escalation from just above 6 to nearly 8.
“The line graph presents average carbon dioxide emissions per individual in four different nations from year 1967 to 2007.”
→ “The line graph presents the average carbon dioxide emissions per individual in four different nations from the year 1967 to 2007.”
“Portugal experience an upward trend”
→ “Portugal experienced an upward trend”
“while the UK experience a down ward trend.”
→ “while the UK experienced a downward trend.”
“carbon dioxide emission experience a fall in Sweden”
→ “carbon dioxide emissions fell in Sweden”
“whereas Italy stayed stable in last 10 years.”
→ “whereas Italy remained stable in the last 10 years.”
“In terms 0f Portugal”
→ “In terms of Portugal”
“between 1967 and 1997 the number of (CO2) emission increased dramatically”
→ “between 1967 and 1997, the amount of CO₂ emissions increased dramatically”
“however, it grow gently in last 10 year.”
→ “however, it grew gently in the last 10 years.”
“the number of carbon dioxide emission rise noticeably in Portugal”
→ “the level of carbon dioxide emissions rose noticeably in Italy” (Portugal repeated incorrectly; should be Italy)
“from from 4 to 6 between 1967 and 1977”
→ “from 4 to 6 between 1967 and 1977” (remove duplicate “from”)
“while between 1977 and 1997 the number of carbon dioxide emission had an quick escalation”
→ “while between 1977 and 1997, the amount of carbon dioxide emissions had a quick escalation”
“from just above 6 to nearly 8.”
→ “from just above 6 to nearly 8 metric tons.
Band score : 5.0
The graph chart presents the average carbon dioxide emissions per person in four countries from 1967 to 2007,
Overall, the Portugal and Italy both countries CO2 emissions increased dramatically , while from 1977 Sweden unexpectedly decreased. However, United Kingdom gently fell from 1977 to 2007.
Focusing on carbon dioxide emissions, the Portugal the amount of carbon dioxide emission considerably upward going from 2.5 to 5.8 in between 1977 to 1997. In terms of, Italy carbon dioxide emission increased notably from 6.3 to 7.9 in 1977 to 1997, from 1997 to steadily stand in 7.9.
Following the emission, Sweden impulsive rise from 8.3 to 10.2 in just ten years and from 1977 Sweden carbon dioxide emission strikingly fell from 10.2 to 7 in 1987. In 1967 United kingdom steadily stand in 10.5, whereas from 1977 the carbon dioxide emission metric tones gradually fell from 10.5 to 8.3. between 1977 to 2007.
“the Portugal and Italy both countries CO2 emissions increased dramatically”
→ “Portugal and Italy both showed a dramatic increase in CO₂ emissions.”
“while from 1977 Sweden unexpectedly decreased.”
→ “while Sweden’s emissions unexpectedly decreased from 1977 onwards.”
“However, United Kingdom gently fell from 1977 to 2007.”
→ “However, carbon dioxide emissions in the United Kingdom fell gradually from 1977 to 2007.”
“the Portugal the amount of carbon dioxide emission considerably upward going”
→ “in Portugal, the amount of carbon dioxide emissions rose considerably”
“from 2.5 to 5.8 in between 1977 to 1997.”
→ “from 2.5 to 5.8 between 1977 and 1997.”
“In terms of, Italy carbon dioxide emission increased notably from 6.3 to 7.9 in 1977 to 1997,”
→ “In terms of Italy, carbon dioxide emissions increased notably from 6.3 to 7.9 between 1977 and 1997,”
“from 1997 to steadily stand in 7.9.”
→ “and then remained steady at 7.9 from 1997 onwards.”
“Sweden impulsive rise from 8.3 to 10.2 in just ten years”
→ “Sweden’s emissions rose sharply from 8.3 to 10.2 in just ten years”
“and from 1977 Sweden carbon dioxide emission strikingly fell from 10.2 to 7 in 1987.”
→ “and from 1977, Sweden’s carbon dioxide emissions fell sharply from 10.2 to 7 by 1987.”
“In 1967 United kingdom steadily stand in 10.5,”
→ “In 1967, the United Kingdom’s emissions stood steadily at 10.5,”
“whereas from 1977 the carbon dioxide emission metric tones gradually fell from 10.5 to 8.3.”
→ “whereas from 1977, carbon dioxide emissions gradually fell from 10.5 to 8.3 metric tons.”
“between 1977 to 2007.”
→ “between 1977 and 2007.
Band score : 5.0
The line graph displays average carbon dioxide emissions per people in united Kingdom ,Italy ,Sweden, and Portugal from 1967 to 2007.
overall, The carbon dioxide emissions increased dramatically in two countries were Portugal ,Italy ,however It was decreased unexpectedly in United kingdom and Sweden both countries.
In terms of Portugal and Italy carbon dioxide emissions grew rapidly ,In 1967 to 1985 it was rise average , In 1987 to 1997 that was boost extensively, where this proportion stable in 1997 to 2007.similarly Italy upward trend grew in that five years.
In another two countries UK and Sweden were decline rapidly from 1967 to 2007 .In 1967 to 1977 Ssweden had increased rapidly. Then it was fall unexpectedly followed by
“overall,”
→ “Overall,” (capitalize the first letter)
“The carbon dioxide emissions increased dramatically in two countries were Portugal ,Italy ,however It was decreased unexpectedly in United kingdom and Sweden both countries.”
→ “Carbon dioxide emissions increased dramatically in Portugal and Italy; however, they decreased unexpectedly in the United Kingdom and Sweden.”
“In terms of Portugal and Italy carbon dioxide emissions grew rapidly ,In 1967 to 1985 it was rise average , In 1987 to 1997 that was boost extensively, where this proportion stable in 1997 to 2007.”
→ “In terms of Portugal and Italy, carbon dioxide emissions grew rapidly. From 1967 to 1985, they rose moderately; from 1987 to 1997, they increased significantly, and then remained stable from 1997 to 2007.”
“similarly Italy upward trend grew in that five years.”
→ “Similarly, Italy showed an upward trend during that five-year period.”
“In another two countries UK and Sweden were decline rapidly from 1967 to 2007.”
→ “In the other two countries, the UK and Sweden, emissions declined rapidly from 1967 to 2007.”
“In 1967 to 1977 Ssweden had increased rapidly.”
→ “From 1967 to 1977, Sweden’s emissions increased rapidly.” (also fix the typo “Ssweden” → “Sweden”)
“Then it was fall unexpectedly followed by – incomplete
Band score : 5.0
The given graph chart displays average carbon dioxide emissions per person in United Kingdom, Sweden, Italy, Portugal between 1967 to 2007.
Overall, Italy and Portugal increased from 1967 to 1997, but Italy was increased extensively, while the number of person grew normally.
Moreover, Portugal, Italy and Sweden were grew between 1967 to 1977 except United Kingdom, though it was decreased after 1977.
In between 1967 to 1977, Italy and Sweden increased rapidly with 4.1 to 6.2 and 8.4 to 10.2 respectively, whereas Portugal was with slow increase from 1967 to 1987 and it was 1 to 3 only. United Kingdom was decreased a small in between 1967 to 1977, while other three were increased. In Sweden from 1977 to 1987 decreased very extensively in between 10.2 to 7.
Italy and Portugal were increased rapidly after 1987 to 1997, however, both were quite stable in between 1997 to 2007. In United Kingdom, between 1977 to 2007 decreased with avarage number from 10.4 to 8.3 . On the other hand Sweden was again decreased between 1987 to 2007 with decent number from 7 to 4.
“Overall, Italy and Portugal increased from 1967 to 1997, but Italy was increased extensively, while the number of person grew normally.”
→ “Overall, carbon dioxide emissions in Italy and Portugal increased from 1967 to 1997, but Italy’s emissions rose significantly, while those in Portugal grew moderately.”
“Moreover, Portugal, Italy and Sweden were grew between 1967 to 1977 except United Kingdom, though it was decreased after 1977.”
→ “Moreover, emissions in Portugal, Italy, and Sweden grew between 1967 and 1977, except in the United Kingdom, where they decreased after 1977.”
“In between 1967 to 1977, Italy and Sweden increased rapidly with 4.1 to 6.2 and 8.4 to 10.2 respectively,”
→ “Between 1967 and 1977, emissions in Italy and Sweden increased rapidly from 4.1 to 6.2 and from 8.4 to 10.2 respectively,”
“whereas Portugal was with slow increase from 1967 to 1987 and it was 1 to 3 only.”
→ “whereas Portugal showed a slow increase from 1967 to 1987, rising only from 1 to 3 metric tons.”
“United Kingdom was decreased a small in between 1967 to 1977, while other three were increased.”
→ “The United Kingdom’s emissions decreased slightly between 1967 and 1977, while the other three countries saw increases.”
“In Sweden from 1977 to 1987 decreased very extensively in between 10.2 to 7.”
→ “In Sweden, emissions decreased sharply from 10.2 to 7 between 1977 and 1987.”
“Italy and Portugal were increased rapidly after 1987 to 1997,”
→ “Italy and Portugal increased rapidly from 1987 to 1997,”
“however, both were quite stable in between 1997 to 2007.”
→ “however, both remained quite stable between 1997 and 2007.”
“In United Kingdom, between 1977 to 2007 decreased with avarage number from 10.4 to 8.3.”
→ “In the United Kingdom, emissions decreased steadily from 10.4 to 8.3 between 1977 and 2007.”
“On the other hand Sweden was again decreased between 1987 to 2007 with decent number from 7 to 4.”
→ “On the other hand, Sweden’s emissions decreased again between 1987 and 2007, falling from 7 to 4 metric tons.”
Band score : 5.5
The graph display average carbon emissions per person in United Kingdom, Sweden, Italy, Portugal counters from the year of 1967 to 2007.
It is clear that the number of carbon dioxide emissions unexpected growth in 1967 to 2007 in the country Portugal and Italy . On the other hand, the number off carbon dioxide emission extensive decrease in United Kingdom .
In terms of the number of carbon dioxide emission very extensive increase in 1967 and 2007 in Portugal. However, Italy and
year of – Preposition error
It is clear that the number of carbon dioxide emissions unexpected growth in 1967 to 2007 in the country Portugal and Italy . On the other hand, the number off carbon dioxide emission extensive decrease in United Kingdom. – SM and poor overview.
Incomplete ……….
Band score : 3.5
The graph demonstrates carbon dioxide emissions average rate of each individuals in different countries between 1967 and 2007.
Overall, it is clear that Portugal and Italy experienced an upward trend of emissions over the period, while there was downward trend in Sweden and United kingdom in 1967 to 2007.
Between 1967 and 1977, the emissions of carbon dioxide was increased slightly from around 1 to 2 metric tonnes, after that period in 1977 to 1997, the average emissions for each person had a dramatic rise from close to 3 to 5 tonnes emissions.
In Sweden and United kingdom, the number of emissions decreased significantly from around 11 to 7 in 1967 from 2007. However,Portugal , between 1977 to
“Overall, it is clear that Portugal and Italy experienced an upward trend of emissions over the period, while there was downward trend in Sweden and United kingdom in 1967 to 2007.”
→ “Overall, it is clear that Portugal and Italy experienced an upward trend in emissions over the period, while Sweden and the United Kingdom showed a downward trend from 1967 to 2007.”
“Between 1967 and 1977, the emissions of carbon dioxide was increased slightly from around 1 to 2 metric tonnes,”
Band score : 5.5
→ “Between 1967 and 1977, carbon dioxide emissions increased slightly from around 1 to 2 metric tons,”
“In Sweden and United kingdom, the number of emissions decreased significantly from around 11 to 7 in 1967 from 2007.”
→ “In Sweden and the United Kingdom, emissions decreased significantly from around 11 to 7 metric tons between 1967 and 2007.”
“However,Portugal , between 1977 to” > Incomplete
The graph compare average carbon dioxide per person in united kingdom ,Sweden , Italy and Portugal counters from 1967 to 2007 .
Overall , the number of carbon di oxide emissions in United kingdom and Sweden was upward trend , while the Portugal and Italy had dowmard trend .on the other hand Italy and Portugal increase dramatically from 1to 5.
In terms of the number of carbon di oxide emission United kingdom and Sweden was decrease , Which the number of 11decrease 9 .
compare > WF
average carbon dioxide per person in united kingdom> SM
the number of carbon di oxide emissions in United kingdom and Sweden was upward trend> SM
.on the other hand Italy and Portugal increase dramatically from 1to 5. > Cap and SM
In terms of the number of carbon di oxide emission United kingdom and Sweden was decrease , Which the number of 11decrease 9 > Punctuation, cap, SM
Band score : 4.0
The graph provides average carbon dioxide emissions per person in United kingdom, Sweden, Italy, Portugal in 1967 to 2007.
Overall, the Portugal and Italy both countries CO2 emissions grow dramatically, whereas on 1977 Sweden are tremendously decrease, while United Kingdom gently drop from 1967 to 2007.
In detail, 1967 to 1977, Portugal and Italy noticeably grow with 2.1 to 4.1 in respectively, on 1967 to 1977, Sweden and United Kingdom are increase by 10.1 to 11.2
Overall, the Portugal and Italy both countries CO2 emissions grow dramatically, whereas on 1977 Sweden are tremendously decrease, while United Kingdom gently drop from 1967 to 2007 > SM and Tense
In detail, 1967 to 1977, Portugal and Italy noticeably grow with 2.1 to 4.1 in respectively, on 1967 to 1977, Sweden and United Kingdom are increase by 10.1 to 11.2 > Unclear info, SM
Incomplete……
Band score : 4.0
The line graph illustrates average carbon dioxide emission per person in four countries from 1967 to 2007 .
Overall , the number of carbon dioxide emission decline dramatically from 1967 to 2007 ,name of the country are United Kingdom . On the other hand, Italy and Portugal are increased tremendously .
In terms of United Kingdom carbon dioxide are rose unexpected 11to 9 metric tones in 1967 to 2007 . In Sweden the amount of carbon dioxide sharply increased from 9 to 10 up in 1967 to 1977 , but in 1977 to 1987 unexpectedly decrease . Than 1987 to 2007 small decline .
In two countries are portugal and italy both are increased dramatically , in 1967 to 1977 are extensive increased , than stable in 1977 to 19
the number of carbon dioxide emission decline dramatically from 1967 to 2007 > SM, Tense
,name of the country are United Kingdom > Tense
In terms of United Kingdom carbon dioxide are rose unexpected 11to 9 metric tones in 1967 to 2007 . In Sweden the amount of carbon dioxide sharply increased from 9 to 10 up in 1967 to 1977 , but in 1977 to 1987 unexpectedly decrease . Than 1987 to 2007 small decline > Tense and sentence making
In two countries are portugal and italy both are increased dramatically , in 1967 to 1977 are extensive increased , than stable in 1977 to 19 > SM
The line graph illustrates average carbon dioxide emissions per person in four different countries from the year 1967 to 2007.
Overall, the emissions in the United Kingdom and Sweden dropped remarkably within the years, while the pollution increased in Italy and Portugal.
Between the year 1967 and 1997, the emission of carbon dioxide in Portugal had an extensive growth from 1 metric ton to nearly 5 metric tons, while Italy met a slight fluctuation. However, from the year 1997 to 2007, the carbon dioxide emissions remained almost stable in both the countries.
In Sweden the pollution increased extensively from 9 to 11 ,between 1967 and 1977, while for the UK it was stable .
In Sweden > Punc.
Incomplete
Band score : 5.5
The line graph display average carbon dioxide emissions per person in four counters from the year 1967 to 2007.
Overall, the number of carbon dioxide emissions unexpected growth in 1967 to 2007 in the country Portugal and Italy . on the other hand the number of carbon dioxide emissions extensive decrease in united Kingdom and the number of carbon dioxide emissions fluctuation in Sweden .
In terms of the number of carbon dioxide emissions very extensive increase in 1967 to 2007 in Portugal . However , Italy the number carbon dioxide emissions extensive rise 1967 to 2007.
In the number of carbon dioxide emissions unexpected rise in United Kingdom it is stuble 1967 tto 1977
counters, stuble,tto , > SP
Overall, the number of carbon dioxide emissions unexpected growth in 1967 to 2007 in the country Portugal and Italy . on the other hand the number of carbon dioxide emissions extensive decrease in united Kingdom and the number of carbon dioxide emissions fluctuation in Sweden > SM, punctuation
In terms of the number of carbon dioxide emissions very extensive increase in 1967 to 2007 in Portugal . However , Italy the number carbon dioxide emissions extensive rise 1967 to 2007. > SM and Unclear
Band : 4.5