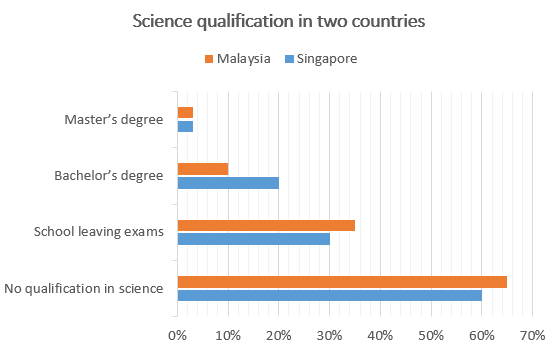
The chart below gives information about science qualifications held by people in two countries in 2018.
Summarise the information by selecting and reporting the main features and make comparison where relevent.
Write at least 150 words
The chart below gives information about science qualifications held by people in two countries in 2018.
Summarise the information by selecting and reporting the main features and make comparison where relevent.
Write at least 150 words
The bar chart compare science qualification between two countries in the year 2018.
From the chart it is clear that , Singapore and Malaysia had no qualification in science compared to other degrees. Although , not having qualification in science is higher then having qualification , the highest number of qualification was bachelor’s degree .
In terms of not having qualification , the proportion of not having a degree is higher as opposed to having one. The higher ratio of degree is bachelor’s degree , on the other hand the least portion of having a degree is master’s degree . In Malaysia , the high ratio was not having a qualification science , which is about 65% , while the lowest ratio was having a master’s degree , which is close to 4% .
In concern of Singapore , similar to Malaysia the highest ratio was not having a qualification in science, which is 60%, while the lowest was having a master’s degree ,which is 3%. The similarity in both of the country was they had the largest percentage in not having a degree as compared to having a degree was the least.
#avoid space before (,)
#work on organisation
#sentence structure (complex)
#work on tense
#informations were repeated
#overview could be better
#The bar chart compare – The bar chart compares
#From the chart it is clear that , – From the chart, it is clear that
#Although , – Although(no comma)
#The higher ratio of degree – The highest ratio of degree
#then – than
#on the other hand – on the other hand(,)
#which is about – which was about
#In concern of – avoid
#both of the country – both of the countries
BAND – 5.0
The chart displays information about science qualifications held by people in two countries in the year 2018.
It is clear that, Malaysia had the highest proportion (70%) at no qualification in science, while Singapore had their highest proportion in this sector. On the other hand, Malaysia and Singapore had almost similar proportion in Master’s degree.
In terms of Master’s degree Malaysia had almost 4% people, while in Singapore they had 1% lower than that. Moreover, in Bachelor’s degree Singapore had approximately 20% people and Malaysia had 10% in this sector.
In School leaving exam Malaysia had approximately 35%,while Singapore had 5% lower than that. In the next, Malaysia and Singapore
both country had their highest proportion on this sector. Malaysia had 65% people at no qualification in science, which is the highest portion on this chart. However Singapore had 60% people at no qualification in science and that is the second highest proportion in this chart.
#overview could be better
#work on punctuation
#avoid mentioning data on overview
#It is clear that, – It is clear that (no comma needed)
#In terms of Master’s degree – In terms of Master’s degree(,)
#4% people – 4% of people
#Singapore they had 1% lower than that – wrong information
#Moreover, in Bachelor’s degree – Moreover, in Bachelor’s degree(,)
#in Bachelor’s degree Singapore had approximately 20% people and Malaysia had 10% in this sector – in Bachelor’s degree(,) approximately 20% of people in Singapore and 10% in Malaysia held this qualification
#both country – both countries
#In the next, Malaysia and Singapore
both country had their highest proportion on this sector. (Unclear)
#which is – which was
#However(,) Singapore had 60% (of) people at no qualification in science(,) and that (was) the second highest proportion in this chart.
BAND – 6.0
The bar chart displays information about science qualifications held by people in Malaysia and Singapore in the year 2018.
Overall, in no qualification in science Malaysia was highest and in master’s degree both Malaysia and Singapore was lowest. Moreover, Malaysia was two time higher in school leaving exams and no qualification in science, at the meantime both were similar in master’s degree, so Malaysia was higher in overall.
In terms of no qualification in science, Malaysia was higher then Singapore with the proportion of 65%. Moreover, both countries was similar at master’s degree contributing 3% each. However, In bachelor’s degree Singapore was dominating and Malaysia was two time less then that with the percentage of 10%.
In school leaving exams, again Malaysia was leading with the portion of 35%, whereas Singapore was at 30%, which was 5% less then Malaysia. However, Malaysia was dominated all the qualifications except bachelor’s degree. In contrast Singapore was dominated by bachelor’s degree with two time higher then Malaysia.
#overview could be better (only mention key features)
#in no qualification in science Malaysia was highest – Malaysia had the highest proportion of people with no qualification in science
#and in master’s degree both Malaysia and Singapore was lowest – (,) however, in master’s degree(,) both Malaysia and Singapore were the lowest
#then – than
#In bachelor’s degree – in bachelor’s degree(,)
#two time less then – two times less than
#Malaysia was dominated – Malaysia dominated
BAND – 6.0
The chart illustrate the information about four different degrees in four subjects in Malaysia and Singapore in 2018.
Overall, No qualification in science had the highest qualification across two countries, while Master’s degree had the lowest . Malaysia was the most qualified in No qualification in science, while in Master’s degree both Malaysia and Singapore people least interested.
Focusing on the top, No qualification in science had the most proportion approximately 65% from Malaysia, this was followed by Singapore, which counties people also highly interested in this with 60%. In contrast, the percentage of Master’s degree was the lowest from all subjects in Malaysia (2%) and also in Singapore (2%).
Regarding School leaving exams, pattern was highest in Malaysia with almost near to 40%. Similarly, Singapore people were also follow the at 30%. Dramatically, Malaysia lose their consistency in Bachelor’s degree at 10%, while Singapore was ten time higher than that with 20%.
#overview could be better
#question understanding
#The chart illustrate – The chart illustrates
#four different degrees in four subjects – wrong information
#No qualification in science had the highest qualification – No qualification in science had the highest percentage of people
#Malaysia was the most qualified – wrong information
#in Master’s degree both Malaysia and Singapore people least interested – in Master’s degree(,) people in both Malaysia and Singapore has the least interest
#Focusing on the top, – avoid
#65% from Malaysia – 65% in Malaysia
#No qualification in science had the most proportion approximately 65% from Malaysia, this was followed by Singapore, which counties people also highly interested in this with 60% – No qualification in science had the highest proportion, approximately 65% in Malaysia, which was followed by Singapore, where 60% people were interested in this category.
#subjects – degrees
#Regarding School leaving exams, pattern was highest – unclear
#Similarly, Singapore people were also follow the at 30% – Similarly, people in Singapore followed closely at 30%
#ten time higher – wrong information
BAND – 4.5
The chart illustrates the principal ways of finding science qualification held by people in two different countries, Malaysia and Singapore.
overall, the majority of Malaysia access through in no qualification in science, while the proportion in the lowest people in master’s degree. however, master’s degree was the proportion in the similar percentage of two different countries.
In master’s degree, the proportion of the 5% science qualification by people in two different countries. Bachelor’s degree is used by 10% of Malaysia and 20% proportion of Singapore. Moreover, Singapore, school leaving exams used in science qualifications, which 5% greater than that of people of Malaysia.
Additionally, No qualification in science the proportion of highest in held by people. Malaysia no qualification in science of 65 percentage. which is 5% less than that in Singapore. In Singapore, the proportion of no qualification in science in 60%. both countries are highest proportion was no qualification in science and similar qualification in master’s degree in two different countries.
The picture illustrates data about science qualification held by people in Malaysia and Singapore in 2018.
overall, In sector of no qualification in science of both countries was the highest proportion for scientific qualification ,However Master’s degree people was the lowest percentage about science qualification.
In Malaysia and Singapore which had no qualification they were more interested to learned about science , the Malaysia people has significant portion in that . Similarly Singapore has 60% number in that. School leaving exams Malaysia proportion is increased than Singapore thair proportion followed by 35% and 30%.
In terms of Bachelor’s degree Singapore was the 20% and Malaysia had the half of percentage of Singapore in 2018.On the other hand at Master’s degree the Malaysia and Singapore both nations had same portion people who had science qualification, it’s percentage was none.it was the lowest amount in that sectors in scientific qualification sector in Malaysia and Singapore.
The bar chart below gives information about science qualifications held by people in two countries in the year 2018.
Overall, Malaysia has most highest people was no qualification in science at almost ratio 66% , while Master’s degree was lowest at almost ratio 5% . But both country almost similar in School leaving exams .
In terms of Malaysia has most highest people was no qualification in science at almost ratio 66% ,while lowest people was Master’s degree at percentage almost 5% . on the other hand, Singapore has people Bachelor’s degree at 20%.
In School leaving exams , Both countries people was almost similar in percentage 30% and 35%. However, Singapore people was highest no qualification in science at ratio 60% , but Malaysia people was highest all cetagoris
The bar graph compare data about the science qualifications held by people in Malaysia and Singapore countries in the year 2018.
Overall , Malaysia countries was highest percentage in No qualification in science ,While the Singapore less than that . However , two countries was similar proportion in Masters degree at 4%.
In the school leaving exam approximately 35 % of total rete was spent by the Malaysia , Which was followed by the Singapore at 30% .No qualification in science on the other hand ,spent their largest proportion on Malaysia at around 65%,whereas the Singapore was at lowest in 5% respectively .
In trems of the Bachelors degree was large proportion in Singapore at 20%,Which Malaysia is halved than that (10%).
The bar chart presents information about science qualifications done by indivituals in two nations in the year 2018.
Overall, Malaysia had the highest proportion in no qualification in science, while Singapore had the largest portion in it at the meantime. However, both countries shared equally in masters degree, although they shared equally but Malaysia dominated most of the sectors with highest proportion.
in terms of no qualification in science, the percentage of Malaysia was the highest with approximately 65%, while Singapore had the largest ratio with 60%. In masters degree, both Malaysia and Singapore shared equally proportion with nearly 10% of each.
In bachelors degree, Singapore dominated the sector with 20 percent, while Malaysia was two times less than that (10%). By contrast, Malaysia reserved 35% in school leaving exams, while Singapore was just bellow with 30%.
The picture illustrate gives information about science qualifications held by people in two countries in the year 2018.
overall,it is clear that the majority of Malaysia access through in no qualification in science,while the proportion in the lowest in master’s degree .however, master’s degree was the proportion in the smillar percentage of two different countries.
in master’s degree,the poportion of the 5% science qualification by people in two different counties .Bechelor’s degree used by 10% of Malaysia and 20% proportion of Singapore .moreover,school leaving exams used in science qualifications.which 5% greather then that of people of Malaysia.
Additionally , No qualification in science the proportion of highest in held by people. Malaysia qualification in 65 percentage in singapore. the proportion in science qualification in 60 percentage.which is 5% less than in Singapore .the proportion of No science qualification in Science in 60% percentage.both countries the highest proportion was no qualification in science in smillar qualification in master’s defree in two different countries.
The bar chart illustrates data about science qualification held by people in Malaysia and Singapore countries in the year of 2018.
It is clear that in sector of no qualification in science of both countries was the highest proportion for scientific qualification . However, Master’s degree people was the lowest percentage about science qualification .
In Malaysia and Singapore which had no qualification they were more interested to learned about science , the Malaysia people has significant portion in that. Similarly Singapore has 60% number in that. School leaving exams Malaysia proportion in increasd than Singapore their proportion followed by 35% and 30%.
In terms of Bachelor’s degree Singapore was the 20% and Mslsysia had the half of percentage of Singapore in 2018 . On the other hand, at portion Master’s degree the Malaysia and Singapore both nation of the
The bar chart compares science qualification held by people in two different countries in the year 2018.
It is clear that, Malaysia had the highest percentage of people qualified in science in school leaving exams, while Singapore had its highest in bachelor’s degree. Most of the people from both countries gained no qualifications in science.
In terms of school leaving exams, Malaysia had 35% of qualified people in science, whereas 30% was reserved by the people of Singapore, which was only 5% less then Malaysia. However, in bachelor’s degree, the percentage of qualified people in Singapore was at 20% , which was 2 times more than the rate of people from Malaysia.
In master’s degree, both country had same number of people ,and the percentage was only 5%. however, both the nation had their highest percentage in no qualification in science, which were respectively at 65% and 60%.
The chart compares about science qualifications held by people in countries , Malaysia and Singapore in 2018 .
Overall the percentage of no qualification was held by Malaysia people was dominated over the period , while Master’s degree had the lowest percentage in the same time .
In 2018 , the bachelor’s degree ratio Malaysia was 10% , on the other hand Singapore ratio was 10% up to Malaysia . while masters degree had the lowest percentage . on the other hand school leaving exams sector qualification ratio is 30% in Malaysia ,and Singapore was (35%) which was 5% less than Malaysia exams qualification .
In terms of no qualification in science , the ratio of Malaysia recorded approximately 60% , and singapore ratio was 65 % , however , The highest ratio was malasia is lowest in masters degree , and highest ratio 65% in science .
The chart provide data about qualifications of science organized by individuals in Malaysia and Singapore in the year of 2018.
overall,the percentage of No qualification was held by Malaysia people was dominated over the period ,while Masters degree had the lowest qualifications in the same period.
in terms of School leaving exams, the ratio of Malaysia recorded approximately half of total, which is followed by Singapore residence, at 30%.On the other hand, becholor’s degree was dominated by Singapore public with 20% and Malaysia had 10% less than that.
In master’s degree, there was a remarkable changes over the period, similarly, both country had their least, contributing around 3%.In contrast, Malaysia reserved highest proportion of qualifications of
science with close to 65% in no qualifications science ,which is
followed by Singapore with 60%.
The chart provides information about science qualifications held by people in two countries in 2018.
Overall, Malaysia was in highest on the no qualification in science and the lowest was masters degree by both of countries Malaysia and Singapore. On School leaving exams Malaysia and Singapore are almost similar by 30% and 40% each, in Bachelors degree Singapore are top by 20% and Singapore was 10%
In terms of no qualification in science Malaysia is the highest by 65% and it was approximately followed by Singapore by 60%, while in school leaving exams Malaysia and Singapore almost similar by (35%) and (30%),
on the Bachelors degree Singapore are topped by 20% and Malaysia was half of them by 10% , In proportion of masters degree Singapore and Malaysia are similar 5% each.
The chart compares the ratio about science qualifications recorded by people in Malaysia and Singapore.
Overall, both countries had highest portion in no qualification in science, while master’s degree had at least. Malaysia led the chart expect in Bachelor’s degree and Master’s degree.
In terms of no qualification in science, Malaysia recorded highest portion with nearly 70%, whereas Singapore had 60% of total portion. However, school leaving exams managed highest portion with 35% in Malaysia, and Singapore held 5% less than Malaysia.
On the other hand, in Bachelor’s degree, Singapore topped the rate with 20%, while Malaysia had a halved of it (10%). Moreover, Master’s degree managed a similar portion in both countries with nearly 5%, which was the lowest portion of this chart.