The bar chart illustrates the number of people in the UK eating more than 5 portions of vegetables and fish per day.
Summarise the information by selecting and reporting the main features, and make comparisons where relevant.
The bar chart illustrates the number of people in the UK eating more than 5 portions of vegetables and fish per day.
Summarise the information by selecting and reporting the main features, and make comparisons where relevant.
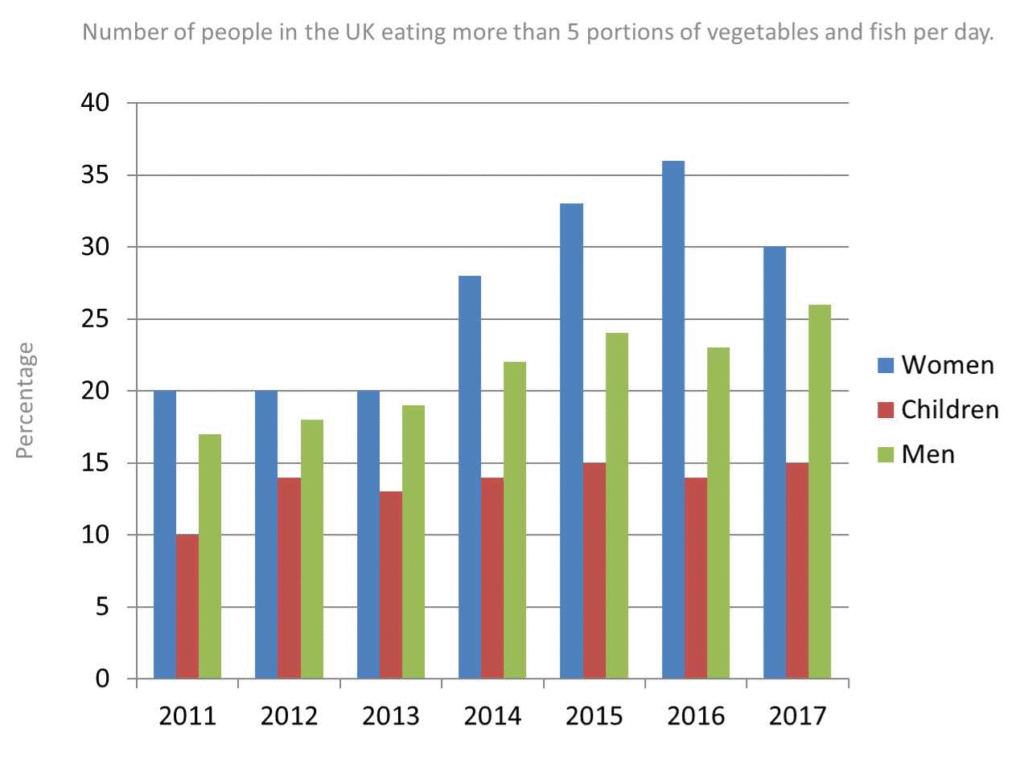
The bar chart provides data about how many people in the UK eat more than 5 portions of vegetables and fish everyday
Overall, the percentage of eating 5 portions of vegetables and fish was increased among women and men over the year, while the percentage in children stayed steady. Moreover, all the three men, women and children’s percentage went high from the starting year.
In terms of female, in 2011, 20% of females ate more than 5 portions of vegetables and fish, which stayed same for the next 3 years, after that it started rising and reached up to 36% in 2015, following next year it dropped a little percentage.
In case of males, in the initial year they had 17%, later on this figure started increasing, and climbed up to 24% in 2016, then it fluctuated for next 2 year. in 2011, children had the percentage of 10 percentage, and this figured went up and down for 6 year, at about 15% they finished in 2017.
The bar chart compares the amount of people eating more than 5 part of vegetables and fish everyday in the UK.
Overall, the highest proportion was noticed in women sector over the period, men sectors portion is much lower. However, the lowest number was at children sector.
In terms of women, from 2011,women’s participation in eating was 20%, while it stayed same(20%) in next two year. Afterwards from 2014 theirs percentage has rise steadily at 28%. After the years it grew rapidly at 37%. But then women’s eating has roughly fall in years of 2017. Now the children had almost close ratio in all of the times. Likely, theirs percentage lowest from other two sectors. theirs eating amount (10%,14%,12%,14%) respectively. In 2015 and 2017 the amount of children eating was slightly close at 15%.
In men, all over the period men’s portion get higher from lowest. There was not any fall of this sector, otherwise it grew up all the time. In 2011 the amount was 17%. After that it slowly risen up into 19%. then it was steadily growing over the period.
The line chart shows the number of population in the United Kingdom eating then 5 proportion of vegetables and fish every day.
Overall, the highest proportion of eating vegetables is women, while the lowest proportion is eating it children. However, women was similar in 2011 and 2013.
In terms of women, the more eating vegetables and fish in 2011, at 20%, while it is similar after 3 years. Moreover, in 2011 children eat 10% vegetable and fish which men eat nearly 17%. Furthermore, between 2012 and 2013, men and children eat vegetable and fish almost 18% and 19% or 14% and 13% respectively. However, in 2014, women eat vegetable and fish the most, at almost 28%, whereas children and men eat it 14% and 22% respectively.
In addition, women eat vegetable and fish 33% in 2015, which men and children followed by them. Nonetheless, women eat was increased and hit the top vegetable and fish in 2016, whereas children and man eat just 14% and 24% respectively. Moreover, in 2017 women eating is decreased, at 30%, while children eat 15%, and man eat increased, at 26%.
The bar chart compares information about the people of UK eating more than 5 types of vegetable and fish in a day.
Overall, the highest number is occupied by women in 2016 and the lowest number had the children in 2011. Children had a low portion over the year.
In 2011, children had actually 10% and it rises slowly year by year. Women had a good percentage from starting, which was 20%. On the other hand, men had almost 17%. In 2012, women had the same percentage as last year. Men had rises a little more to 18% and children had 14% in this year. In 2013, the whole ratio was almost similar with last 2 years. Women, children and men had 20%, 13%, and 19% respectively.
The bar chart illustrates the number of different categories both male and female in the 5 portions of vegetables and fish every day.
Overall, the highest of 2016 was 36 in male. and the lowest was children just under ups and downs. and the men was the second lowest was 26.
In terms of vegetables and fish per day, the women was in 2011 was just touch the 20. and the children was 10. at the last of men was crossed the 17. however, 2012 was the same at 20. and the red was children increased was 14. and the men was 18. on the 2013, the women always had the same at 2013. and the children was
The bar chart proportion women, children and men eating five different vegetables and fish in the UK.
Overall, women was similar number in first 3 years. However, the children number are up down in the every year.
In terms, women eating rate was similar in 2011 to 2013 in 20%. But the men number was slowly up in 2011 to 2015 in around 17% to 24% and the next year it down and the eating rate was almost 24%. On the other hand the number children was lowest in 10% in 2011 but the next five its up and down.
In 2014 the women rate was up in around 28% and it increase was 36% in 2016. However it decrease 6% in 2017. Men rate was decrease in 2016 but next year it increase in 26%.
The bar chart in the percentage of people in the UK children and men eating five vegetable and fish in the UK.
Overall, women are the most vegetable and fish, while children ate least during at all years.
In 2011 around 20% or women are more than five protions per day, compared with about 17% of men and 12% of children than the figures rose steaidly, and by 2014, women reached around 35%, men 27% and children 25%. After that all groups dropped little but stayed higher than the starting point in 2011.
In general women always had the highest percentage by men, in 2014 the women rate was up in around 28% and it increase was 36% in 2016.
The bar chart compares the information about the proportion of people in the United Kingdom eating more than 5 portions of vegetables and fishes each day.
Overall, the highest percentage had eaten women, whereas the lowest was children. However, the ratio of eating vegetables and fish was increased by men.
In terms of female, the figure was started from 20 percent, which was remain the same percentage from 2011 to 2013.This figure had dramatically went up 28% to over the 35%, while this figure had went down slightly from over the 35 % to 30 % in 2017.Moreover, between the 2011 and 2017 ,the men was increased from 16% to over the 25%.
turn
The bar chart illustrates information about the number of people in the United Kingdom more than 5 proportion of vagetables and fish per day.
Overall, although the highest number of people eating vagetables of Women, the Childrens had the lowest figure. However, the men had the proportion increased every years.
In terms of 2013 and 2014, the eating vegetables increased slightly in Women, children and Men and this figure reached by around 20% to 27%, 13% to 14% and, 18% to 21% respectively. Morever, the highest people eating vegetables Women in 2016, which was almost 36%, while the lowest figure was Children and second highest was women in this year. Between 2011 and 2012, the women had the similar ratio which was 20% but 2% increased in Children and Men.
On the other hand, the Women had the second highest eating vagetables in 2015, which was almost 33%, while women had the ratio was almost 24% and 9% less than children that. In contrast, the Men had the highest proportion compares others, while children had the proportion was only 15% and women had around 11% greater that.
The bar graph illustrates information about the different types of peoples eating habit who ate more five portion of vegetables and fish in the UK, between 2011 and 2017.
Overall, women ate more rather than other throughout the period. However, the highest percentage of women ate each dushes in 2016 as compared to men in 2017.
in terms of 2011, the more eating vegetables anfd fish in women stood at 20% that was equal portin over the gollowing two years, and then it went up gradually and reached its peak in 2016, which accounted for up to 35% before having a fall at 30% oin 2017. Furthermore, children eatting habit experienced fluctuation over the period which had the highest increase both in 2015 and 2017 as opposed the least decrease at the beginning of period that ranged between 10% anf 15% respectively.
Nevertheless, men chose more vegetables and fish for eating i n 2017 that had almost 27%, while at the beginning of three years this figure had almost remained unchanged, however, percentage rate increased in 2015 by around 7%, before dropped by 2% remaining two years.