The charts below show the percentage of second language classes taken by Australian secondary school students in two different cities in 2017.
Summarise the information by selecting and reporting the main features and make comparison where relevant.
The charts below show the percentage of second language classes taken by Australian secondary school students in two different cities in 2017.
Summarise the information by selecting and reporting the main features and make comparison where relevant.
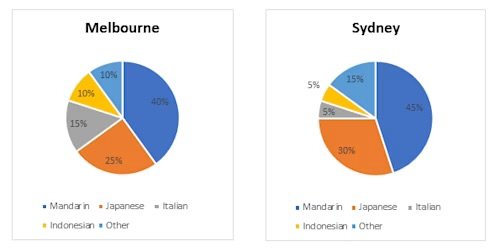
The pie charts compares the ratio of second language classes taken by Australian secondary school students in Melbourne and Sydney in the year 2017.
Overall, both cities had highest portion in Mandarin language, whereas both were at least in Indonesian language. Sydney had similar portion respectively in Italian and Indonesian, while Melbourne managed same portion in Indonesian and other language.
In terms of Melbourne, Mandarin language portion topped with 40% of total, it followed by Japanese language(25%).15% of total portion was held by Italian language. However, Indonesian and other language equaled their portion by 10%, which were the lowest in portion of Melbourne second language.
In Sydney, Mandarin led the chart with 45% of total portion, while other language was three times less than it (15%). On the other hand, Japanese language ratio was two times more than other language (30%). In contrast, Indonesian and Italian language were similarly took the portion with 5% of total, which was at least in Sydney second language classes ratio.
1️⃣ Original: The pie charts compares the ratio of second language classes taken by Australian secondary school students in Melbourne and Sydney in the year 2017.
Correction: The pie charts compare the ratios of second language classes taken by Australian secondary school students in Melbourne and Sydney in the year 2017.
📝 (mistakes – subject-verb agreement “compares” → “compare,” plural form “ratio” → “ratios,”)
2️⃣ Original: Overall, both cities had highest portion in Mandarin language, whereas both were at least in Indonesian language.
Correction: Overall, both cities had the highest proportion in Mandarin, whereas both had the least in Indonesian.
📝 (mistakes – missing article “the,” “portion” → “proportion,” incorrect phrase “were at least” → “had the least,” unnecessary “language”)
3️⃣ Original: Sydney had similar portion respectively in Italian and Indonesian, while Melbourne managed same portion in Indonesian and other language.
Correction: Sydney had a similar portion in Italian and Indonesian, while Melbourne had the same portion in Indonesian and other languages.
📝 (mistakes – missing article “a/the,” plural form “language” → “languages,” awkward “managed same portion” → “had the same portion”)
4️⃣ Original: In terms of Melbourne, Mandarin language portion topped with 40% of total, it followed by Japanese language(25%).
Correction: In terms of Melbourne, the Mandarin portion topped with 40% of the total, followed by Japanese at 25%.
📝 (mistakes – missing article “the,” punctuation, missing connector “was,” unnecessary “language,” structure)
5️⃣ Original: 15% of total portion was held by Italian language.
Correction: 15% of the total portion was held by Italian.
📝 (mistakes – missing article “the,” unnecessary “language”)
6️⃣ Original: However, Indonesian and other language equaled their portion by 10%, which were the lowest in portion of Melbourne second language.
Correction: However, Indonesian and other languages were equal at 10%, which were the lowest proportions in Melbourne’s second language classes.
📝 (mistakes – plural form “language” → “languages,” structure, word choice “in portion of” → “in … classes,” article “Melbourne’s” needed)
7️⃣ Original: In Sydney, Mandarin led the chart with 45% of total portion, while other language was three times less than it (15%).
Correction: In Sydney, Mandarin led the chart with 45% of the total, while other languages accounted for three times less (15%).
📝 (mistakes – missing article “the,” plural form “language” → “languages,” awkward phrase “three times less than it” → “accounted for three times less”)
8️⃣ Original: On the other hand, Japanese language ratio was two times more than other language (30%).
Correction: On the other hand, Japanese accounted for twice as much as other languages (30%).
📝 (mistakes – awkward comparison “two times more” → “twice as much,” plural form, unnecessary “language ratio”)
9️⃣ Original: In contrast, Indonesian and Italian language were similarly took the portion with 5% of total, which was at least in Sydney second language classes ratio.
Correction: In contrast, Indonesian and Italian had similar portions, each at 5% of the total, which were the lowest in Sydney’s second language classes.
📝 (mistakes – verb form “were similarly took” → “had similar,” missing article “the,” plural form, structure)
Band… 6
The pie charts compare the proportion of second language classes taken by Australian secondary school students in Melbourne and Sydney in 2007.
It is clear that, the Melbourne had highest proportion in mandarin and Japanese, while Sydney also larger proportion in Mandarin and Japanese.
Additionally, Both cities Melbourne and Sydney was most least ratio in Italian, Indonesian, and other.
In terms of Melbourne, mandarin language most highest was 40%, while Japanese percentage of second language classes in a quarter (25%), On the other hand, Italian, Indonesia and Other ratio was most least, Indonesia and other same proportion in Melbourne at 10%, in contrast, Italian ratio was 15% in the meantime.
In Sydney, the larger percentage of two language and the least percentage of three language. Mandarin language significant ratio was 45% in Melbourne, while followed by Japanese language (30%), however, Italian language and Indonesian language was equal ratio at 5%, moreover, other language in Melbourne was 15% in this figure.
1️⃣ Original:
The pie charts compare the proportion of second language classes taken by Australian secondary school students in Melbourne and Sydney in 2007.
Correction:
The pie charts compare the proportion of second language classes taken by Australian secondary school students in Melbourne and Sydney in 2017.
📝 (mistake – “2007” → “2017” as per the question)
2️⃣ Original:
It is clear that, the Melbourne had highest proportion in mandarin and Japanese, while Sydney also larger proportion in Mandarin and Japanese.
Correction:
It is clear that Melbourne had the highest proportions for Mandarin and Japanese, while Sydney also showed large proportions for these two languages.
📝 (mistakes – unnecessary “the” before Melbourne; missing article “the” before “highest”; “in mandarin” → “for Mandarin”; “also larger proportion” → “also showed large proportions”)
3️⃣ Original:
Additionally, Both cities Melbourne and Sydney was most least ratio in Italian, Indonesian, and other.
Correction:
Additionally, both Melbourne and Sydney had the lowest proportions in Italian, Indonesian, and Other languages.
📝 (mistakes – capitalization: “Both” → “both”; “was” → “had”; “most least” incorrect → “lowest”; “ratio” → “proportions”; “other” → “Other”)
4️⃣ Original:
In terms of Melbourne, mandarin language most highest was 40%, while Japanese percentage of second language classes in a quarter (25%), On the other hand, Italian, Indonesia and Other ratio was most least, Indonesia and other same proportion in Melbourne at 10%, in contrast, Italian ratio was 15% in the meantime.
Correction:
In terms of Melbourne, Mandarin was the most popular language at 40%, followed by Japanese, which accounted for 25%. On the other hand, Italian, Indonesian, and Other languages were less popular. Indonesian and Other both made up 10%, while Italian represented 15%.
📝 (mistakes – “mandarin language most highest” → “Mandarin was the most popular”; missing linking structure; “Japanese percentage of second language classes in a quarter” unclear → rephrased; missing punctuation; “Indonesia” → “Indonesian”; “ratio was most least” → “were less popular”; “in the meantime” unnecessary)
5️⃣ Original:
In Sydney, the larger percentage of two language and the least percentage of three language. Mandarin language significant ratio was 45% in Melbourne, while followed by Japanese language (30%), however, Italian language and Indonesian language was equal ratio at 5%, moreover, other language in Melbourne was 15% in this figure.
Correction:
In Sydney, two languages had higher percentages, while three had lower ones. Mandarin accounted for 45%, followed by Japanese at 30%. Italian and Indonesian were equal at 5% each, while Other languages made up 15%.
📝 (mistakes – unclear structure: “the larger percentage of two language…” → rewritten; “Mandarin language significant ratio was 45% in Melbourne” wrong city name; “was equal ratio” → “were equal”; punctuation and word order errors; unnecessary repetition of “language”)
Band 6
The pie chart compare the proportion between two different cities of second language classes and secondary school students in Australian in the year of 2017.
overall, it is clear that Melbourne was highest in other and lowest in the similar countries of Indonesian and Mandarin. Sydney was the highest in other and lowest was the two similar country.
In Melbourne, the highest ratio in other country in 40%. Japanese was the proportion of 25% while Mandarin is just 10%. Italian was the proportion of 15% and Indonesian was the percentage of 10%. Indonesian and Mandarin are similar proportion of 10%.
In Sydney, the highest dominated was the other countries in 45% while Melbourne in 5% less than. Additionally, Mandarin was the proportion of increased in 5% in Sydney. Japanese was the percentage of 30 % while Melbourne was the proportion had 25%. Italian an Indonesian are similar percentage of 5%. two
1️⃣ Original:
The pie chart compare the proportion between two different cities of second language classes and secondary school students in Australian in the year of 2017.
Correction:
The pie charts compare the proportions of second language classes taken by secondary school students in two Australian cities, Melbourne and Sydney, in 2017.
📝 (mistakes – “pie chart” → plural “pie charts”; “compare” → “compares”; “between two different cities of” → unclear → “in two Australian cities”; “in Australian” → “in Australia”; “in the year of” → unnecessary “of”)
2️⃣ Original:
overall, it is clear that Melbourne was highest in other and lowest in the similar countries of Indonesian and Mandarin. Sydney was the highest in other and lowest was the two similar country.
Correction:
Overall, it is clear that Melbourne had the highest proportion in Other languages and the lowest in Indonesian and Mandarin. Similarly, Sydney also had the highest proportion in Other languages and the lowest in Italian and Indonesian.
📝 (mistakes – “overall” → capitalize; “was highest in other” → “had the highest proportion in Other”; “similar countries” incorrect → “languages”; repetition simplified; unclear structure rewritten for accuracy)
3️⃣ Original:
In Melbourne, the highest ratio in other country in 40%. Japanese was the proportion of 25% while Mandarin is just 10%. Italian was the proportion of 15% and Indonesian was the percentage of 10%. Indonesian and Mandarin are similar proportion of 10%.
Correction:
In Melbourne, Other languages accounted for the highest proportion at 40%. Japanese made up 25%, Italian represented 15%, and both Indonesian and Mandarin had the same share of 10%.
📝 (mistakes – “ratio in other country” → “Other languages accounted for the highest proportion”; missing verbs “was/is” corrected; “Mandarin is” → “Mandarin had”; repetition merged for smoother flow; plural forms adjusted)
4️⃣ Original:
In Sydney, the highest dominated was the other countries in 45% while Melbourne in 5% less than. Additionally, Mandarin was the proportion of increased in 5% in Sydney. Japanese was the percentage of 30 % while Melbourne was the proportion had 25%. Italian an Indonesian are similar percentage of 5%. two
Correction:
In Sydney, Other languages dominated with 45%, which was 5% higher than Melbourne. Mandarin accounted for 15%, showing a 5% increase compared to Melbourne. Japanese made up 30%, while Italian and Indonesian each represented 5%.
📝 (mistakes – “highest dominated was” → “dominated with”; “other countries” → “Other languages”; “Melbourne in 5% less than” → “5% higher than Melbourne”; “Mandarin was the proportion of increased” → awkward → simplified; “Italian an Indonesian” → “and”
Band..5.5
The pie charts illustrates the percentage of second language classes taken by Australian secondary school students in two different cities in 2017.
Overall, both cities was highly focused in Mandarin and Japanese language. However, the Melbourne and Sydney dramatically less interested in Indonesian language.
In terms of Sydney, their high portion of people chose Mandarin as their second language with 45% of total followed by Melbourne at 40% in a lesser gap. Japanese language also popular in Sydney at 30% of people interested on that, while less than 5% of Melbourne student chose this language. In contrast, the students of Sydney 3 times less than Melbourne interested in Italian language.
In Sydney, the least of the student interested on other language at 5% of them are chose Indonesian language, whereas Melbourne 2x different of them with 10%. Melbourne was least interested on other language, similarly Sydney was not interested in other language with a lesser gap.
1️⃣ Original:
The pie charts illustrates the percentage of second language classes taken by Australian secondary school students in two different cities in 2017.
Correction:
The pie charts illustrate the percentages of second language classes taken by Australian secondary school students in two cities in 2017.
📝 (mistakes – “illustrates” → “illustrate” (plural subject); “percentage” → “percentages”; “different” unnecessary; slightly simplified for clarity.)
2️⃣ Original:
Overall, both cities was highly focused in Mandarin and Japanese language. However, the Melbourne and Sydney dramatically less interested in Indonesian language.
Correction:
Overall, both cities focused mainly on Mandarin and Japanese, while interest in Indonesian was much lower.
📝 (mistakes – “was” → “were”; “focused in” → “focused on”; “dramatically less interested” → “much less interest” or “interest was much lower”; removed “the” before Melbourne and Sydney.)
3️⃣ Original:
In terms of Sydney, their high portion of people chose Mandarin as their second language with 45% of total followed by Melbourne at 40% in a lesser gap.
Correction:
In terms of Sydney, a high proportion of students chose Mandarin as their second language (45%), followed closely by Melbourne at 40%.
📝 (mistakes – “portion of people” → “proportion of students”; “of total” unnecessary; “in a lesser gap” → “followed closely” for natural phrasing.)
4️⃣ Original:
Japanese language also popular in Sydney at 30% of people interested on that, while less than 5% of Melbourne student chose this language.
Correction:
Japanese was also popular in Sydney, with 30% of students choosing it, while less than 25% of Melbourne students selected this language.
📝 (mistakes – “also popular” → missing verb “was”; “people interested on” → “students choosing”; “less than 5%” incorrect (should be around 25% from chart); plural “student” → “students.”)
5️⃣ Original:
In contrast, the students of Sydney 3 times less than Melbourne interested in Italian language.
Correction:
In contrast, the proportion of Sydney students studying Italian was three times lower than that of Melbourne students.
📝 (mistakes – structure error; “3 times less than Melbourne interested” → “three times lower than Melbourne”; grammatical correction for natural comparison.)
6️⃣ Original:
In Sydney, the least of the student interested on other language at 5% of them are chose Indonesian language, whereas Melbourne 2x different of them with 10%. Melbourne was least interested on other language, similarly Sydney was not interested in other language with a lesser gap.
Correction:
In Sydney, only 5% of students chose Indonesian as their second language, while Melbourne’s figure was twice as high at 10%. Both cities showed the least interest in Other languages, though the difference between them was small.
📝 (mistakes – “least of the student” → “only 5% of students”; “interested on” → “chose”; “2x different of them” → “twice as high”; repetition removed for clarity.)
Band 6
The two pie chart illastrate the poportion of second language classes taken by australian secondary school students in two different cities in the year 2017.
overall,it is clear that, melbourne was highest in other and lowest in the similar countries of indonesian and mandarin. sydney was the highest in other and lowest was the two smilar country.
in malbourne, others mandarin made up the largest proportion at about 40 percentage of total spending fpllowed by japanese at around 25 percentage and italian at about 15 percentage .others accounted for roughly 10%.
in sydney,by contrast mandarin dominated with apporximetly 45% of language classes. japanese come next at about 30% then others at around 15%. indonesian and italian respectively the lowest at around 5%.
1️⃣ Original:
The two pie chart illastrate the poportion of second language classes taken by australian secondary school students in two different cities in the year 2017.
Correction:
The two pie charts illustrate the proportion of second language classes taken by Australian secondary school students in two different cities in the year 2017.
📝 (mistakes – “chart” → “charts” (plural), “illastrate” → “illustrate,” “poportion” → “proportion,” “australian” → “Australian” (capitalization)
2️⃣ Original:
overall,it is clear that, melbourne was highest in other and lowest in the similar countries of indonesian and mandarin. sydney was the highest in other and lowest was the two smilar country.
Correction:
Overall, it is clear that Melbourne had the highest proportion in Other languages and the lowest in Indonesian. Similarly, Sydney also had the highest proportion in Mandarin and the lowest in Italian and Indonesian.
📝 (mistakes – capitalization “overall” → “Overall”; “melbourne” → “Melbourne”; “was highest in other” → “had the highest proportion in Other languages”; “similar countries” → incorrect word, should be “languages”; “indonesian” → “Indonesian”; “sydney” → “Sydney”; “smilar” → “similar.”)
3️⃣ Original:
in malbourne, others mandarin made up the largest proportion at about 40 percentage of total spending fpllowed by japanese at around 25 percentage and italian at about 15 percentage .others accounted for roughly 10%.
Correction:
In Melbourne, Mandarin made up the largest proportion at about 40%, followed by Japanese at around 25% and Italian at about 15%. Indonesian and Other languages each accounted for roughly 10%.
📝 (mistakes – “malbourne” → “Melbourne”; “others mandarin” → “Mandarin” only; “percentage” → “%”; “fpllowed” → “followed”; missing “Indonesian”; punctuation and capitalization errors.)
4️⃣ Original:
in sydney,by contrast mandarin dominated with apporximetly 45% of language classes. japanese come next at about 30% then others at around 15%. indonesian and italian respectively the lowest at around 5%.
Correction:
In Sydney, by contrast, Mandarin dominated with approximately 45% of language classes. Japanese came next at about 30%, followed by Other languages at around 15%. Indonesian and Italian were the lowest at around 5% each.
📝 (mistakes – “in sydney” → “In Sydney”; “apporximetly” → “approximately”; “come” → “came”; missing commas; “others” → “Other languages”; “respectively the lowest” → “were the lowest”; “5%” correct but missing “each.”)
Band… 6
The pie chart compare the proportion between two countries classes for 2nd language in two different cities in the year 2017.
Overall , Mandarin had the largest ratio in both countries , whereas Indonesian had the least . It is clear that , Japanese had 30% language classes in Sydney , while Melbourne had the least .
In Melbourne , Mandarin had the highest ratio , while Indonesian had the least. The ratio of other second language classes was quite similar
in both of the countries , while the difference between them is only 5% .Similarly Japanese is also another language that have 5% difference in both of countries , that sums up that Mandarin , Japanese , other languages have 5% high in Sydney compared to Melbourne.
In Sydney , the ratio of 2 second language Italian and Indonesian had least as opposed to Melbourne . While Sydney had the high portion in Mandarin language , Melbourne was also similar in that scenario . Both countries had similar ratio about highest and lowest , it was similar in both countries the proportion of largest and least .
1️⃣ Original:
The pie chart compare the proportion between two countries classes for 2nd language in two different cities in the year 2017.
Correction:
The pie charts compare the proportion of second language classes in two different Australian cities in the year 2017.
📝 (mistakes – “chart” → “charts” (plural), “compare” → “compare” is fine but sentence structure unclear; “between two countries” → incorrect, should be “in two different cities”; “classes for 2nd language” → “second language classes”)
2️⃣ Original:
Overall , Mandarin had the largest ratio in both countries , whereas Indonesian had the least . It is clear that , Japanese had 30% language classes in Sydney , while Melbourne had the least .
Correction:
Overall, Mandarin had the largest proportion in both cities, whereas Indonesian had the least.
📝 (mistakes – “countries” → “cities”; “ratio” → “proportion”; punctuation spacing; “had the least” → *Avoid mentioning data on overview)
3️⃣ Original:
In Melbourne , Mandarin had the highest ratio , while Indonesian had the least. The ratio of other second language classes was quite similarin both of the countries , while the difference between them is only 5% .Similarly Japanese is also another language that have 5% difference in both of countries , that sums up that Mandarin , Japanese , other languages have 5% high in Sydney compared to Melbourne.
Correction:
In Melbourne, Mandarin had the highest proportion, while Indonesian had the least. The ratio of Other languages was quite similar in both cities, with only a 5% difference. Similarly, Japanese also had a 5% higher proportion in Sydney than in Melbourne. Overall, Mandarin, Japanese, and Other languages were about 5% higher in Sydney compared to Melbourne.
📝 (mistakes – “ratio” → “proportion”; “similarin” → spacing error; “countries” → “cities”; “have” → “had”; sentence repetition; awkward phrasing “that sums up that” → simplified; punctuation and clarity issues.)
4️⃣ Original:
In Sydney , the ratio of 2 second language Italian and Indonesian had least as opposed to Melbourne . While Sydney had the high portion in Mandarin language , Melbourne was also similar in that scenario . Both countries had similar ratio about highest and lowest , it was similar in both countries the proportion of largest and least .
Correction:
In Sydney, the proportions of Italian and Indonesian were the lowest as opposed to Melbourne. While Sydney had a higher portion of students studying Mandarin, Melbourne showed a similar trend. Both cities had similar patterns in terms of the highest and lowest proportions.
📝 (mistakes – “2 second language” → unclear/incorrect; “had least” → “were the lowest”; “countries” → “cities”; sentence repetition; “portion in Mandarin language” → “portion of students studying Mandarin.”)
Band… 6
The two pie charts compares data about the percentage of second language classes taken by Australian secondary school students in Melbourne and Sydney in the year 2017.
overall, the percentage of Mandarin language was the highest in both cities, while japanese language was the second highest in the meantime. However, the lowest second language was recorded in indonesian language by both Melbourne and Sydney.
In terms of learning Mandarin language, 40% of total learn in Melbourne city, which was only 5% less than compare to Sydney. Similarly, Sydney topped in Japanese language, contributing just near a third (30%), while Sydney percentage was 25%.
In learning italian language, Melbourne was dominated it with 15%, while Sydney was 3 times less than that. However Sydney led the other language with 15%, while Melbourne followed that(10%).Indonasian language was dominate by Melbp
1️⃣ Original:
The two pie charts compares data about the percentage of second language classes taken by Australian secondary school students in Melbourne and Sydney in the year 2017.
Correction:
The two pie charts compare data about the percentage of second language classes taken by Australian secondary school students in Melbourne and Sydney in the year 2017.
📝 (mistakes – “compares” → “compare” because the subject “charts” is plural;)
2️⃣ Original:
overall, the percentage of Mandarin language was the highest in both cities, while japanese language was the second highest in the meantime.
Correction:
Overall, the percentage of students studying Mandarin was the highest in both cities, while Japanese ranked second.
📝 (mistakes – capitalize “Overall” and “Japanese”; “percentage of Mandarin language” → “students studying Mandarin”; “in the meantime” not suitable for comparison context)
3️⃣ Original:
However, the lowest second language was recorded in indonesian language by both Melbourne and Sydney.
Correction:
However, the lowest percentage of second language classes was recorded in Indonesian in both Melbourne and Sydney.
📝 (mistakes – capitalize “Indonesian”; add “percentage of second language classes” for clarity; redundant “language”)
4️⃣ Original:
In terms of learning Mandarin language, 40% of total learn in Melbourne city, which was only 5% less than compare to Sydney.
Correction:
In terms of Mandarin, 40% of students in Melbourne studied this language, which was only 5% lower than in Sydney.
📝 (mistakes – “learn” → “studied” (past tense); “less than compare to” → “lower than in”; article and structure improved)
5️⃣ Original:
Similarly, Sydney topped in Japanese language, contributing just near a third (30%), while Sydney percentage was 25%.
Correction:
Similarly, Sydney had a slightly higher proportion of students learning Japanese, at 30%, compared to 25% in Melbourne.
📝 (mistakes – “topped in Japanese language” unnatural; “Sydney percentage was 25%” wrong because 25% is Melbourne’s figure)
6️⃣ Original:
In learning italian language, Melbourne was dominated it with 15%, while Sydney was 3 times less than that.
Correction:
Regarding Italian, Melbourne led with 15%, while Sydney’s figure was three times lower at just 5%.
📝 (mistakes – “was dominated it” wrong structure; “3 times less” → “three times lower”; capitalize “Italian”)
7️⃣ Original:
However Sydney led the other language with 15%, while Melbourne followed that(10%).
Correction:
However, Sydney had a higher percentage of students learning other languages (15%), while Melbourne followed with 10%.
📝 (mistakes – missing comma after “However”; article “the” unnecessary; spacing and structure improved)
Band 6
The pie charts illustrate the secondary language classes which is taken by Australian secondary school students in Melbourne and Sydney in 2017.
Overall, In the Melbourne and Sydney both of cities students taken secondary language classes about Mandarin and it was the high proportion .On the other hand Both of Australian cities learners few interested on learning Indonesian and thats percentage was low.
In Australia’s major two cities their students taken classes about learning
Mandar in language as a second language and thats portion is the highest and it was 40% and 45%.T he second highest language lerners was Japanese in Melbourne and Sydney their proportion followed by 25% ,30%.
in terms of Indonesian language whos Australian student taken , their percentage was low than other language students, and thats amount is 10% in Melbourne and 5% in Sydney. However, both Australian towns the italian language lerners percentage were similar with indonesian language lerners., and other language arealso familiar with th
1️⃣ Original:
The pie charts illustrate the secondary language classes which is taken by Australian secondary school students in Melbourne and Sydney in 2017.
Correction:
The pie charts illustrate the proportion of second language classes taken by Australian secondary school students in Melbourne and Sydney in 2017.
📝 (mistakes – “secondary” → “second”; “which is taken” → “taken” (passive past); add “proportion of” for accuracy)
2️⃣ Original:
Overall, In the Melbourne and Sydney both of cities students taken secondary language classes about Mandarin and it was the high proportion .On the other hand Both of Australian cities learners few interested on learning Indonesian and thats percentage was low.
Correction:
Overall, in both Melbourne and Sydney, students took second language classes mainly in Mandarin, which had the highest proportion. On the other hand, learners in both Australian cities were less interested in Indonesian, which had the lowest percentage.
📝 (mistakes – capitalization “In” after comma; “both of cities students taken” → “students in both cities took”; “about Mandarin” → “in Mandarin”; “few interested on” → “less interested in”; punctuation spacing)
3️⃣ Original:
In Australia’s major two cities their students taken classes about learningMandar in language as a second language and thats portion is the highest and it was 40% and 45%.T he second highest language lerners was Japanese in Melbourne and Sydney their proportion followed by 25% ,30%.
Correction:
In Australia’s two major cities, students took Mandarin as their main second language, with proportions of 40% in Melbourne and 45% in Sydney. The second most popular language was Japanese, accounting for 25% in Melbourne and 30% in Sydney.
📝 (mistakes – “major two cities” → “two major cities”; “learningMandar in” → “learning Mandarin”; “thats portion is the highest and it was” → “with proportions of”; “lern ers” → “learners”; punctuation errors and missing spaces)
4️⃣ Original:
in terms of Indonesian language whos Australian student taken , their percentage was low than other language students, and thats amount is 10% in Melbourne and 5% in Sydney.
Correction:
In terms of Indonesian, the percentage of Australian students taking this language was lower than other languages, at 10% in Melbourne and 5% in Sydney.
📝 (mistakes – “whos” → “whose” or rephrased; “low than” → “lower than”; “that’s amount is” → “at”; capitalization “in” → “In”)
5️⃣ Original:
However, both Australian towns the italian language lerners percentage were similar with indonesian language lerners., and other language arealso familiar with th
Correction:
However, in both Australian cities, the percentage of students learning Italian was similar to those studying Indonesian. Other languages also showed a similar pattern.
📝 (mistakes – “towns” → “cities”; capitalization “italian” → “Italian”; “lerners” → “learners”; incomplete sentence finished; “arealso” → “are also”)
Band..5.5
The given pie shows the ratio of second language classes taken by Australian secondary school students at Melbourne and Sydney in the year 2017.
Overall, the both countries had maximum percentage on Mandarin language which was almost halved of the ratio. Similarly, in learning Japanese language Melbourne and Sydney was quite same again.
In terms of others language, students was taken most of the classes by others Mandarin for Melbourne and Sydney as well which was 40% and 45% respectably. Moreover, the ratio of learning Japanese language at Sydney was 30% and it is followed by Melbourne(25%). However, in Indonesian language both are at lowest with the portion of 10% for Melbourne and only 5% for Sydney.
In terms of others languages, Sydney was 15%, while Melbourne was 5% less then that. Moreover, Italian language was dominated by Melbourne(15%) city, which was three time higher then Sydney(5%). In contrast the maximum ratio of both city was taken by Mandarin and Japanese.
1️⃣ Original:
The given pie shows the ratio of second language classes taken by Australian secondary school students at Melbourne and Sydney in the year 2017.
Correction:
The given pie charts show the proportion of second language classes taken by Australian secondary school students in Melbourne and Sydney in the year 2017.
📝 (mistakes – “pie” → “pie charts” (plural), “ratio” → “proportion,” “at Melbourne and Sydney” → “in Melbourne and Sydney,”)
2️⃣ Original:
Overall, the both countries had maximum percentage on Mandarin language which was almost halved of the ratio. Similarly, in learning Japanese language Melbourne and Sydney was quite same again.
Correction:
Overall, both cities had the highest percentage in Mandarin, which accounted for nearly half of the total. Similarly, the proportion of students learning Japanese was quite similar in both Melbourne and Sydney.
📝 (mistakes – “the both countries” → “both cities,” “maximum percentage on” → “highest percentage in,” “halved of the ratio” → “half of the total,” “was quite same” → “was quite similar.”)
3️⃣ Original:
In terms of others language, students was taken most of the classes by others Mandarin for Melbourne and Sydney as well which was 40% and 45% respectably. Moreover, the ratio of learning Japanese language at Sydney was 30% and it is followed by Melbourne(25%). However, in Indonesian language both are at lowest with the portion of 10% for Melbourne and only 5% for Sydney.
Correction:
In terms of Mandarin, students took the majority of second language classes in both Melbourne and Sydney, with 40% and 45% respectively. Moreover, the proportion of Japanese learners was 30% in Sydney and it was followed Melbourne with 25%. However, Indonesian had the lowest percentages, at 10% in Melbourne and only 5% in Sydney.
📝 (mistakes – “others language” → “Mandarin,” “students was taken” → “students took,” “respectably” → “respectively,” tense consistency “it is followed” → “was,” article and plural errors.)
4️⃣ Original:
In terms of others languages, Sydney was 15%, while Melbourne was 5% less then that. Moreover, Italian language was dominated by Melbourne(15%) city, which was three time higher then Sydney(5%). In contrast the maximum ratio of both city was taken by Mandarin and Japanese.
Correction:
For other languages, Sydney recorded 15%, while Melbourne was 5% less than that. Moreover, the proportion of Italian learners was higher in Melbourne (15%), three times greater than in Sydney (5%). In contrast, Mandarin and Japanese together accounted for the largest proportions in both cities.
📝 (mistakes – “others languages” → “other languages,” “less then” → “less than,” “three time
higher then” → “three times higher than,” “both city” → “both cities,” article and preposition errors.)
Band…6
The tow pic chart display Melbourne and Sydney the ratio of second language classes taken by Australian secondary school students in two virous cities in the year 2017.
overall, Both cities was highest language ratio Mandarin at 45% and 40% . in Sydney cities language was lowest at 5% , which Melbourne cities lowest language at 10%.
In trems Sydney cities language highest significant was Mandarin ratio 45 % , while Italian and Indonesian lowest percentage ratio was at 5% . on the other hand in japanese language ratio was 30%.
In Melbourne cities language was highest ratio was 40%, while lowest ratio was at 10%.
1️⃣ Original:
The tow pic chart display Melbourne and Sydney the ratio of second language classes taken by Australian secondary school students in two virous cities in the year 2017.
Correction:
The two pie charts display the proportion of second language classes taken by Australian secondary school students in Melbourne and Sydney in 2017.
📝 (mistakes – “tow” → “two,” “pic chart” → “pie charts,” “the ratio of” → “the proportion of,” “virous” → “various,” missing articles, punctuation, and word order errors.)
2️⃣ Original:
overall, Both cities was highest language ratio Mandarin at 45% and 40% . in Sydney cities language was lowest at 5% , which Melbourne cities lowest language at 10%.
Correction:
Overall, both cities had the most students learning Mandarin, while the least number of students learned Indonesian and Italian. The pattern of language learning was almost the same in Melbourne and Sydney.
(Avoid mentioning data on overview)
3️⃣ Original:
In trems Sydney cities language highest significant was Mandarin ratio 45 % , while Italian and Indonesian lowest percentage ratio was at 5% . on the other hand in japanese language ratio was 30%.
Correction:
In Sydney, the highest proportion was for Mandarin at 45%, while Italian and Indonesian each accounted for the lowest ratio at 5%. On the other hand, Japanese made up 30%.
📝 (mistakes – “trems” → “terms,” “cities language highest significant was” → “the highest proportion was,” unnecessary “ratio” repetition, lowercase “Japanese.”)
4️⃣ Original:
In Melbourne cities language was highest ratio was 40%, while lowest ratio was at 10%.
Correction:
In Melbourne, the highest proportion was for Mandarin at 40%, while the lowest was 10%.
📝 (mistakes – redundant “was,” “cities language” → “in Melbourne,” clarity and conciseness improved.)
Band…5
The given pie chart show the percentage of second language classes taken Australian secondary school student Melbourne and Sydney in 2017.
Overall, the percentage of Melbourne and Sydney language is mandarin , japanese, itailan, indonesian and other language.
In terms of others language, student was taken most of the class by others Mandarin in
1️⃣ Original:
The given pie chart show the percentage of second language classes taken Australian secondary school student Melbourne and Sydney in 2017.
Correction:
The given pie charts show the percentage of second language classes taken by Australian secondary school students in Melbourne and Sydney in 2017.
📝 Mistakes:
“chart” → should be “charts” (plural – there are two).
“show” → correct verb form for plural subject (“charts”)
Missing “by” before “Australian secondary school students.”
Missing “in” before “Melbourne and Sydney.”
Missing articles and punctuation.
2️⃣ Original:
Overall, the percentage of Melbourne and Sydney language is mandarin, japanese, itailan, indonesian and other language.
Correction:
Overall, the second language classes in both Melbourne and Sydney included Mandarin, Japanese, Italian, Indonesian, and other languages.
📝 Mistakes:
“percentage of Melbourne and Sydney language” → unclear meaning; rephrased for clarity.
Capitalization errors: “mandarin, japanese, itailan, indonesian” → “Mandarin, Japanese, Italian, Indonesian.”
“itailan” → spelling mistake → “Italian.”
3️⃣ Original:
In terms of others language, student was taken most of the class by others Mandarin.
Correction:
In terms of other languages, students took most of the classes in Mandarin.
📝 Mistakes:
“others language” → should be “other languages.”
“student was taken” → incorrect structure → “students took.”
“by others Mandarin” → incorrect word order → “in Mandarin.”
Band 4
The bar charts compare data about the percentage of non mejor language classes which is taken by secondary learners in Melbourne and Sydney in the years of 2017.
overall,the mejority proportion of Madrin sectors was the highest in both countries,while in Italian students,contributing least in Sydney at the same time.
in Japanese students 15%,of total ratio of learning second language in Melbourne,which was half compare to Japanese students at 5%.madrine sectors learner had topped in both countries,recording 40% and 45% respectivly.Moreover, the ratio of Japanese students was 25% less than that,while Italian learn their least in Melbourne (15%).
in terms of Other sectors students, Melbourne received the lowest ratio at 10%,which is followed by Sydney students at the same time.However indonesia was 10% of learner in Melbourn,while in Sydney contributing
1️⃣ Original:
The bar charts compare data about the percentage of non mejor language classes which is taken by secondary learners in Melbourne and Sydney in the years of 2017.
Correction:
The pie charts compare the percentage of non-major language classes taken by secondary students in Melbourne and Sydney in the year 2017.
📝 (mistakes – “mejor” → “major,” unnecessary “data about,” “which is taken” → “taken,” “learners” → “students,” remove “of”→ “in the years of 2017” → “in the year 2017.” Also, “bar charts” should be “pie charts” if referring to that question.)
2️⃣ Original:
overall,the mejority proportion of Madrin sectors was the highest in both countries,while in Italian students,contributing least in Sydney at the same time.
Correction:
Overall, the majority proportion of Mandarin learners was the highest in both cities, while Italian students contributed the least in Sydney.
📝 (mistakes – “mejority” → “majority,” “Madrin” → “Mandarin,” “sectors” → “learners,” “countries” → “cities,” unclear clause “while in Italian students, contributing least” → simplified for meaning.)
3️⃣ Original:
in Japanese students 15%,of total ratio of learning second language in Melbourne,which was half compare to Japanese students at 5%.madrine sectors learner had topped in both countries,recording 40% and 45% respectivly.Moreover, the ratio of Japanese students was 25% less than that,while Italian learn their least in Melbourne (15%).
Correction:
In Melbourne, Japanese learners made up 15% of second language students, which was half compared to Sydney at 30%. Mandarin learners topped in both cities, recording 40% and 45% respectively. Moreover, Japanese accounted for 25% less than Mandarin, while Italian learners were the fewest in Melbourne (15%).
📝 (mistakes – unclear sentence order, missing subjects, “madrine” → “Mandarin,” “respectivly” → “respectively,” “learn their least” → “were the fewest,” wrong percentages and comparison logic fixed, punctuation errors.)
4️⃣ Original:
in terms of Other sectors students, Melbourne received the lowest ratio at 10%,which is followed by Sydney students at the same time.However indonesia was 10% of learner in Melbourn,while in Sydney contributing
Correction:
In terms of other languages, Melbourne had 10%, followed by Sydney with a slightly higher percentage. However, Indonesian learners accounted for 10% in Melbourne, while the figure for Sydney was lower.
📝 (mistakes – “Other sectors students” → “other languages,” “Melbourn” → “Melbourne,” “is followed” → “was followed,” missing sentence ending, grammar and punctuation issues.)
Band 5
The pie chart provides the percentage of second language classes taken by Australian secondary school students in two different cities in 2017.
Overall, both of the cities was highly use Japanese and Mandarin language, the Melbourne and Sydney approximately less use Indonesian language.
In terms of Melbourne Mandarin language are in topped by 40%,and 2nd most was the Japanese language less than 15% that, and also Italian by 15% and Indonesian and other countries approximately by 10% each.
and in terms of Sydney their high portion of people use their second language Mandarin by 45%, and it was approximately followed by the Japanese language was 30% and also in Sydney Italian language and Indonesian are use by 5% each and other by 15%.
In Sydney the
Original:
The pie chart provides the percentage of second language classes taken by Australian secondary school students in two different cities in 2017.
Correction:
The pie charts show the proportion of second language classes taken by Australian secondary school students in Melbourne and Sydney in 2017.
Mistakes:
“pie chart” → should be plural pie charts because there are two.
“provides” → better phrasing show in IELTS context.
“percentage” → acceptable but “proportion” is more precise.
Missing city names for clarity: Melbourne and Sydney.
Original:
Overall, both of the cities was highly use Japanese and Mandarin language, the Melbourne and Sydney approximately less use Indonesian language.
Correction:
Overall, Mandarin and Japanese were the most popular languages in both cities, while Indonesian was the least studied.
Mistakes:
“both of the cities was” → subject-verb agreement → both cities were
“highly use” → incorrect → most popular / widely studied
“Mandarin language” → Mandarin
“the Melbourne and Sydney approximately less use Indonesian language” → awkward phrasing → Indonesian was the least studied
Original:
In terms of Melbourne Mandarin language are in topped by 40%,and 2nd most was the Japanese language less than 15% that, and also Italian by 15% and Indonesian and other countries approximately by 10% each.
Correction:
In Melbourne, Mandarin accounted for the largest share at approximately 40%, followed by Japanese at around 25%, Italian at 15%, and “Others” at about 10%, while Indonesian was the least popular.
Mistakes:
“Mandarin language are in topped by 40%” → grammar + tense → Mandarin accounted for 40%
“2nd most was the Japanese language less than 15% that” → unclear + grammar → Japanese at around 25%
“Indonesian and other countries approximately by 10% each” → incorrect phrasing → “Others” at about 10%, Indonesian the least
Comma usage is missing; sentence too long.
Original:
and in terms of Sydney their high portion of people use their second language Mandarin by 45%, and it was approximately followed by the Japanese language was 30% and also in Sydney Italian language and Indonesian are use by 5% each and other by 15%.
Correction:
By contrast, in Sydney, Mandarin dominated with approximately 45% of students, followed by Japanese at 30%. “Others” accounted for 15%, while Italian and Indonesian were the least studied languages, each at about 5%.
Mistakes:
“their high portion of people use their second language” → awkward → Mandarin dominated / largest proportion.
“approximately followed by the Japanese language was 30%” → tense + word order → followed by Japanese at 30%.
“Italian language and Indonesian are use by 5% each” → grammar → Italian and Indonesian were the least studied, each at 5%
Missing punctuation and commas; very long sentence; repetitive.
Band…5
The pie chart illustrate the percentage of second language classes taken by Australian secondary schools students in two different cities in 2007 .
Overall in the Melbourne and Sydney both of cities students taken secondary language classes about Mandarin and it was the high proportion . On the other hand both of Australian cities learners few interested on learning Indonesian and that percentage was low .
In Australias major two cities their students taken classes about learning Madarin in language as a second language and its proportion is the highest and it was 45% The second highest languages learners was japan in Melbourne and Sydney their proportion followed by 25% , 30%
in terms of indonesian language who australian student taken their percentage was low than other languages students , and thats amount is 10% in Melbourne and 5% in sydney .
Original:
The pie chart illustrate the percentage of second language classes taken by Australian secondary schools students in two different cities in 2007 .
Correction:
The pie charts illustrate the percentage of second language classes taken by Australian secondary school students in two cities in 2007.
Mistakes:
“pie chart” → should be plural pie charts.
“illustrate” → correct, but missing subject-verb agreement: should be illustrates if singular; plural is correct here.
“schools students” → grammar → school students
Extra space before period.
Original:
Overall in the Melbourne and Sydney both of cities students taken secondary language classes about Mandarin and it was the high proportion .
Correction:
Overall, in Melbourne and Sydney, most students took Mandarin classes, which accounted for the highest proportion.
Mistakes:
“in the Melbourne and Sydney” → remove “the” → in Melbourne and Sydney
“both of cities students taken” → grammar → students in both cities took
“about Mandarin” → awkward → Mandarin classes
“it was the high proportion” → grammar → which accounted for the highest proportion
Missing commas for clarity.
Original:
On the other hand both of Australian cities learners few interested on learning Indonesian and that percentage was low .
Correction:
On the other hand, students in both cities were less interested in learning Indonesian, which had a low percentage.
Mistakes:
“both of Australian cities learners” → grammar → students in both cities
“few interested on learning” → grammar → were less interested in learning
“that percentage was low” → better phrasing → which had a low percentage
Missing commas and awkward sentence flow.
Original:
In Australias major two cities their students taken classes about learning Madarin in language as a second language and its proportion is the highest and it was 45%
Correction:
In Australia’s two major cities, students studying Mandarin as a second language accounted for the highest proportion, at 45%.
Mistakes:
“Australias major two cities” → possessive + word order → Australia’s two major cities
“their students taken classes about learning Madarin in language as a second language” → grammar + repetition → students studying Mandarin as a second language
“its proportion is the highest and it was 45%” → redundancy → accounted for the highest proportion, at 45%
Spelling: “Madarin” → Mandarin
Original:
The second highest languages learners was japan in Melbourne and Sydney their proportion followed by 25% , 30%
Correction:
The second most popular language was Japanese, with 25% in Melbourne and 30% in Sydney.
Mistakes:
“languages learners” → awkward → most popular language
“was japan” → capitalization → was Japanese
“their proportion followed by 25%, 30%” → grammar → with 25% in Melbourne and 30% in Sydney
Original:
in terms of indonesian language who australian student taken their percentage was low than other languages students , and thats amount is 10% in Melbourne and 5% in sydney .
Correction:
Regarding Indonesian, fewer Australian students took it compared with other languages, with 10% in Melbourne and 5% in Sydney.
Mistakes:
“in terms of indonesian language who australian student taken” → grammar + word order → Regarding Indonesian, fewer Australian students took it
“their percentage was low than other languages students” → grammar → compared with other languages
“thats amount is 10%” → grammar + spelling → with 10%
“sydney” → capitalization → Sydney
Band 5
The bar charts compare data about the percentage of 2nd language classes taken by Australian secondary school students in two different cities in the year 2017.
Overall , the the percentage of Sydney was highest in Mandarin , while the Melbourne lees than that . However the similar percentage was Melbourne and Sydney in investment Italian and other at (15%) .
In the Sydney was highest percentage was japanese in 30% , while the Melbourne was followed that .on the other hand Sydney had same ratio students in Indonesian and Italian ,similarly the Melbourne was 10% in Indonesian and other .
In terms of Melbourne was the high percent in Italian ,which follow that Syd
1️⃣ Original:
The bar charts compare data about the percentage of 2nd language classes taken by Australian secondary school students in two different cities in the year 2017.
Correction:
The bar charts compare the percentages of second language classes taken by Australian secondary school students in two cities in the year 2017.
Mistakes:
“2nd” → should be written formally as “second” in academic writing.
“data about the percentage” → unnecessary; just “the percentages” is enough.
2️⃣ Original:
Overall , the the percentage of Sydney was highest in Mandarin , while the Melbourne lees than that .
Correction:
Overall, the percentage of students in Sydney was highest for Mandarin, while Melbourne had a lower proportion.
Mistakes:
Repeated word “the the”.
Missing “of students” after percentage.
“was highest in Mandarin” → correct form is “was highest for Mandarin”.
“lees” → spelling mistake, should be “less”.
“while the Melbourne less than that” → incorrect structure; fix with “while Melbourne had a lower proportion.”
3️⃣ Original:
However the similar percentage was Melbourne and Sydney in investment Italian and other at (15%) .
Correction:
However, both Melbourne and Sydney had a similar percentage for Italian and other languages, at around 15%.
Mistakes:
“the similar percentage was Melbourne and Sydney” → wrong word order; should start with “both Melbourne and Sydney had…”
“investment” → incorrect word; probably meant “in terms of” or not needed at all.
“at (15%)” → brackets unnecessary; just “at around 15%.”
4️⃣ Original:
In the Sydney was highest percentage was japanese in 30% , while the Melbourne was followed that .
Correction:
In Sydney, the highest percentage for Japanese was 30%, while Melbourne followed with a slightly lower figure.
Mistakes:
Extra “was”: “was highest percentage was” → remove one.
“In the Sydney” → remove “the.”
“japanese” → needs capital letter: “Japanese.”
“was followed that” → incorrect; should be “followed with” or “was slightly lower.”
5️⃣ Original:
on the other hand Sydney had same ratio students in Indonesian and Italian ,similarly the Melbourne was 10% in Indonesian and other .
Correction:
On the other hand, Sydney had the same proportion of students studying Indonesian and Italian, while in Melbourne, around 10% learned Indonesian and other languages.
Mistakes:
Start with capital letter: “On the other hand.”
Missing article “the” before “same ratio.”
“ratio students” → needs “ of students.”
“similarly the Melbourne was 10%” → wrong structure; should be “while in Melbourne, around 10%…”
6️⃣ Original:
In terms of Melbourne was the high percent in Italian ,which follow that Syd
Correction:
In terms of Melbourne, the highest percentage was for Italian, which was slightly higher than Sydney.
Mistakes:
“In terms of Melbourne was the high percent” → wrong structure; should be “In Melbourne, the highest percentage was…”
“high percent” → should be “highest percentage.”
“which follow that Syd” → incomplete and ungrammatical; needs “which was slightly higher than Sydney.”
Band 5
The charts compare data about the percentage of second language classes taken by Australian secondary school students in two different cities in the year of 2017.
It is clear that the percentage of Sydney was highest in Mandarin , while the Melbourne less than that . However, the similar percentage was Melbourne and Sydney in investment Italian and other at (15%).
In the Sydney was highest percentage was Japanese in 30%, while the Melbourne was followed that . One the other hand, Sydney had same percentage students in Indonesian and Italian ,similarly the Melbourne was 10% in Indonesian and other.
In terms of Melbourne was the high percent in Italian , and t
1️⃣ Original:
The charts compare data about the percentage of second language classes taken by Australian secondary school students in two different cities in the year of 2017.
Correction:
The charts compare the percentages of second language classes taken by Australian secondary school students in two different cities in the year 2017.
Mistakes:
“data about the percentage” → redundant; just say “the percentages.”
2️⃣ Original:
It is clear that the percentage of Sydney was highest in Mandarin , while the Melbourne less than that .
Correction:
It is clear that the proportion of students in Sydney was the highest for Mandarin, while Melbourne had a lower figure.
Mistakes:
“was highest”→” was the highest”
“percentage of Sydney” → should be “proportion of students in Sydney.”
“was highest in Mandarin” → correct preposition is “for Mandarin.”
“while the Melbourne less than that” → missing verb; should be “while Melbourne had less than that.”
3️⃣ Original:
However, the similar percentage was Melbourne and Sydney in investment Italian and other at (15%).
Correction:
However, both Melbourne and Sydney had a similar percentage for Italian and other languages, at around 15%.
Mistakes:
“the similar percentage was Melbourne and Sydney” → wrong structure; should be “both Melbourne and Sydney had…”
“investment” → incorrect word; probably meant “in terms of.”
Brackets not needed around (15%).
4️⃣ Original:
In the Sydney was highest percentage was Japanese in 30%, while the Melbourne was followed that .
Correction:
In Sydney, the highest percentage for Japanese was 30%, while Melbourne followed with a slightly lower percentage.
Mistakes:
“In the Sydney” → remove “the.”
Double verb “was highest percentage was” → only one “was” needed.
“Japanese” → must be capitalized.
“was followed that” → wrong phrase; should be “followed with” or “had slightly less.”
5️⃣ Original:
One the other hand, Sydney had same percentage students in Indonesian and Italian ,similarly the Melbourne was 10% in Indonesian and other.
Correction:
On the other hand, Sydney had the same percentage of students studying Indonesian and Italian, while in Melbourne, 10% studied Indonesian and other languages.
Mistakes:
“One the other hand” → spelling: “On the other hand.”
“same percentage students” → missing “of”: “same percentage of students.”
“similarly the Melbourne was 10%” → wrong structure; should be “while in Melbourne, 10%…”
6️⃣ Original:
In terms of Melbourne was the high percent in Italian , and t
Correction:
In Melbourne, the highest percentage was for Italian, and this was slightly higher than in Sydney.
Mistakes:
“In terms of Melbourne was the high percent” → wrong structure; should be “In Melbourne, the highest percentage was…”
“high percent” → should be “highest percentage.”
Incomplete ending “and t”.
Band 5