The graph below shows the percentage of population who rode bicycle in an Australian town in 2009.
Summaries the information by selecting and reporting the main features and make comparison where relevant.
The graph below shows the percentage of population who rode bicycle in an Australian town in 2009.
Summaries the information by selecting and reporting the main features and make comparison where relevant.
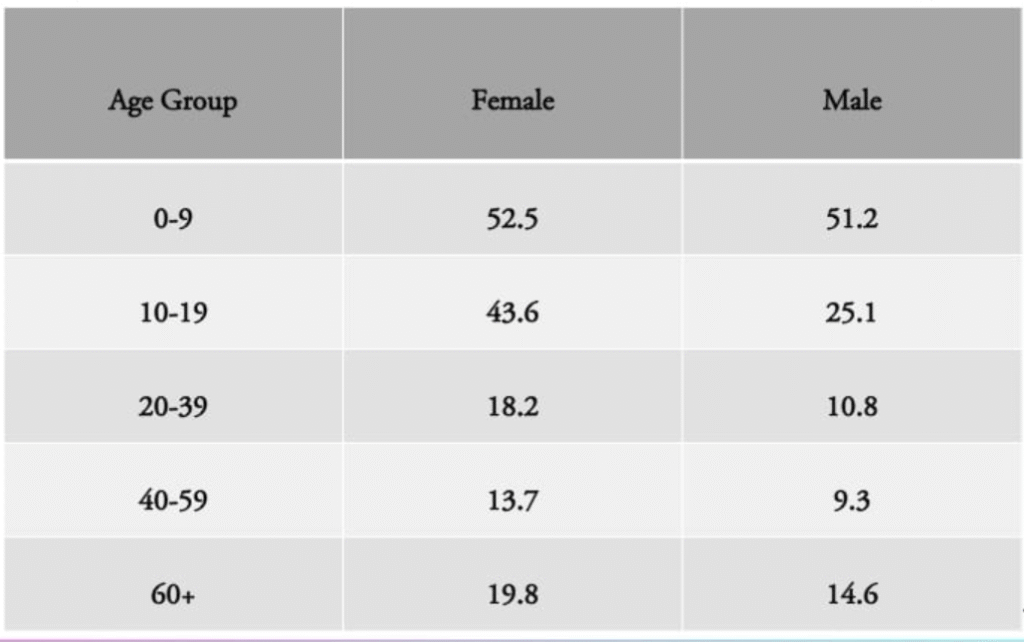
The table compares the proportion between men and women riding bicycle in an Australian town in the year 2009.
Overall, Female rode more bicycle than men , the difference between them was about 5% . Although , men rode least bicycle as opposed to women , in terms of age between 40-49 it was kind of 2 times lesser than them.
In concern of male , in all ages they were the least compared to women , which is interesting , while only 0-9 ages male was quite similar to women , cause the difference was only 1% . It is clear from the table , in all ages women was more active at riding , while men were never higher then women.
At riding bicycle , 0 to 9 years old was largest in both men and women , on the other hand the lowest were 20 to 29 years old , which is also similar in men and women. Although , men is lowest than women , both of them were similar at categories of ages who was high and low. In men , 40 to 59 years old rode lowest bicycle than other ages , which was 9.3 ratio that was followed by 20 to 39 years old , which was 10.8 portion .
The table chart displays the proportion of population who rode bicycle in an Australia town in the year 2009.
Overall, Female had the highest proportion of population from all, while male recorded the least. However, 20-39 age group of people had lowest portion in an Australian town.
In terms of female, they had the 52.5% in 0-9 age group of people in an Australian town. However, female had the least of their population compared to others. In 10-19 category people female had 43.6%, which is the second highest portion in this category. in 40-59 age group of people had 13.7% female ,which is the lowest in female category.
In male sector, they had the highest portion 51.2% in 0-9 age group of people, while 40-59 male age group of people recorded the least. On the other hand, male age group of people had 25.1% in 10-19 age group of people in an Australian town, which is the second highest in this category. Moreover,20-39 age group of people had 10.8% male.
The table illustrate the proportion of rode bicycle in an Australian cities in 2009.
overall, the proportion of female highest in 52.5 in 0-9 age group and lowest proportion in 13.7 in 40-59 ages. The male proportion of highest in 51.2 in ages group in 0-9 and the lowest was the proportion of 9.3 in 40-59 ages. The proportion of female and male was the similar age groups in higher and lower.
Additionally, Age group 0-9 in female and male was the same ways but some less than that of male. 10-19 age group in female was the proportion of 43.6 and male was the proportion halved in 25.1. The female rode bicycle 18.2 in age group of 20-39, while 8% less than that in male.
Furthermore, The proportion of male rode bicycle in 9.3 which female was the proportion of 13.7 in age group of 40-59. However, on the other hand, 60+ age group the proportion of 19.8 the female while 14.6 in male in the rode bicycle in Australian cities. The lowest proportion of age group in 40-59 which female was the percentage in 13.7 and male was the proportion in 9.3 in cities.
The table chart compares the proportion of men and women population who rode bicycle in a town of Australia in the year 2009.
Overall, female had the highest proportion in 0 to 9 age group, while it was followed by male in the meantime. Female led the 40-59 years group, male had the least.
In terms of 0-9, women had the highest ratio with 52.5%, whereas men followed it with just above 50% (51.2). Similarly, women dominated the the 10-19 years age group with 43.6%, while the least was recorded by male. However in 20 to 39 age, female had the highest portion with 18.2%, male, although, received the lowest with almost two times less than that (10.8).
In contrast, the age group of 40-59 was led by female with 13.7%, men had their least at the same time. However, 60+ group had the highest proportion with 19.8% which was recorded by female, while male had the least with just bellow 15% (14.6%).
The table chart illustrate the percentage of population who rode bicycle between male and female in an Australia town in the year 2009 with some of age groups.
Overall, 0-9 age group male and female was led the whole other groups in Australia. However, male was lowest in this, and female was dominated the most of this.
In terms of, Female was top of the table with 52.5% in 0-9 age group, similarly male was lesser gap with 51.2% on this group. In 10-19 age group male was almost two times lesser than female with 25.1%. Dramatically, the 60+ age group was also dominated by the female (19.8%), whereas male was right behind at 14.6%
In contrast, the lowest portion in bicycle rode was male at 9.3% in 40-59 age group, while female was higher with 13.7%. In 20-39 age group female had the higher proportion with 18.2%, where male was lowest with 10.8%.
The given table displays the proportion of male and female with different age group who rode bicycle in an Australian town in the year 2009.
Overall, male and female were highest at the age of 0-9, but female was a little bit higher than male in this age group. However, again male and female were lowest at after age of 40 to 59, moreover female was led this age group also.
In the age group (0-9) both male and female were highest at the meantime, though female was dominated (52.5%) in this age group. In the age of 40-59 male was lowest with the ratio of 9.3%, which was around 4% less then female(13.7%). However, female dominated every age group with huge different of portion except 0-9 age group, female was very serious about rode bicycle the table shows it.
In the age of 20-39, female was almost two time higher than male with the percentage of 18.2% and age of 10-19 was also male followed by female , whereas male had only 10.8% in that age group. At the age group 60 or above female was led with proportion 19.8%, while male had 14.6% in that age.
The table compares the percentage of population man and women rode bicycle in an Australian town in the year 2009.
Overall, women was the highest number of age 0-9 and man was least number of age 9.3 in bicycle. however man and women between lower to 40-59.
The trams of rode bicycle woman was highest number of age 0-9 at 59 percentage, while man rode bicycle lowest number of age 40-59 ratio 9.3. however ,in number of age 20-39 man and women rode bicycle ratio was 18.2% and 10.8%.
In numbers of age 40-39 man and women
The table illustrates the proportion number of people’s who driven bicycle in an Australian in 2009.
Overall, In table at the children who’s age was under 9 their percentage were highest in the both female and male in bicycle ride category . However, the middle age population in that, was lowest portion.
In terms of female their participation at riding bicycle as the highest level in 0 to 9 years old and that’s percentage was 52. 5. and that’s portion was down at the age of 40 to 59 (13.7). Male portion was highest also in that age , male was similar proportion in that they had also decreased rode bicycle in that age 40 to59, percentage was 9.3%.
on the other hand, female had more portion in age of 10 to 19 but the male percentage was low than female. In 20 to 39 female was also highest amount than male. Also the last stage of age female were more riding bicycle 19.08% and male was low.
The table chart compares the percentage of population man and women rode bicycle in an Australian town in the year of 2009.
It is clear that women was the highest number of age 0-9 and man was least number of age 9.3 % in bicycle . However, men and women between lower to 40-59.
The terms of rode bicycle women was highest number of 0-9 at 59 percentage , while man was rode bicycle lowest number of age 40-59 ratio 9.3% . However , in number of age 20-39 man and women rode bicycle 18.2% and 10.8%.
In the number of age 0-9 age group was equal
The graph chart illustrates the proportion of population rode bicycle in an Australian town in 2009 .
Overall , men and women had taken the largest portion of bicycle population in 0-9 age group from all, while they are age was 40 to 59 they taken the lowest percentage in 2009 .
In terms of age in 0-9 women spent the majority proportion of bicycle , which was almost 52.5 % . And these age the men portion as 51.2 ,which was almost 521.2 % . However in bicycle , men and women spent equal proportion of their age .The age was 40 to 59 that time the proportion was lowest , the percentage was men and women (13.7 % , 9.3 ) .
On the other hand women had more portion in age of 10 to 9 but the men percentage was low than women . In 20 to 39 women was also highest amount than male . Also the stage of women were more cycleing 19.8 % .
The table chart presents the proportion of bicycle riders in a particular town in Australia in the year 2009.
Overall, the greatest portion of riders was among the age group of 0-9, and there was not so much difference in terms of percentage between male and female riders. the people of 40-59 age group rode bicycle the least , in which female can be considered ahead of male riders.
Looking at male participants of the age group between 0-9, they were at 51.2%, which reduced to a quarter when it came to people of 10-19 age group(25.1%). However, the female riders were the most in percentage from the age group of 0-9 (52.5%), which also reduced when it came to the age group of people from 10 to 19 (43.6%).
The table chart compares the percentage of population male and female rode bicycle in an Astralian town in the year 2009 .
Overall , Female road more bicycle than men ,the different between them was about 5%.Although , men rode bicycle as opposed tpo women ,in terms of age between 40-59.
In concern of ,Female cycle road was higher proportion in all age ,while the male followed by them .on the other hand ,60+age Female on 19.8 rode cycling Whereas ,the male at 14.8 . However (0-9) age group was similar portion in Female and Male . 10-19 year age was Female majority percent Which, Male less than that .
In the 0-9 age group was equal ratio all of them ,while the 20-23 age was cycling is higest in Female and Male is lowest .
The table compares the proportion of population who rode bicycle in an Australian town in the year 2009.
overall,female was the highest in o-9 and male was least to 9.3 percentage in bicycle.However Female and Male between lower to 40-59.
In terms of rode bicycle women was highest number age age group 0-9 at 52.5 percentage.while man was rode bicycle lowest number of age group 40-59 at 9.3 percentage.however in number of age 20-39 man and women rode biycle 18.2 percentage and 10.8 percentage.
In numbers of age group 10-19 was highest in 18.2 and least was
The table chart provides the percentage of population who ride bicycle in an Australian town in 2009.
Overall, 0-9 age group Male and female are the highest compares to the others groups in Australia. However the age of 40-59 was the lowest proportion who rode bicycle in Australia.
In terms of , Female was the highest of the table 52.5% in age 0-9, and Male also almost similar by 51.2%, in age 10-19 Female was led by 43.6% and Male was almost 50% lesser than that, the 60+ group of age Female are dominated by 19.8% and are lower than that by 14.6%.
In contrast the lowest was the age between 40-59 was male are the lowest by 9.3% and female are topped by 13.%, on age 20-39 group age female are top by 18.2% and male are lower by