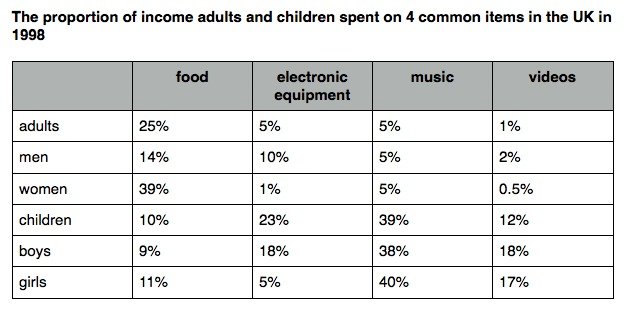
The table illustrates of the percentage of earned money adults and children spent on food, electronic equipment, music, and videos in the UK in the year 1998.
Overall, the highest number of proportion spent on food by women, while again women was lowest on videos spent. Music were top incoming sectors then others remaining section.
In terms of adults, adults were highest in the food at 25%, and lowest on the videos just 1%. electronic equipment and music similar trend followed by 5%. In men, food was the highest proportion at 14%, while remaining all sectors were above 10%. By women, women top on the food and least on the videos in 39% and 0.5%, whereas remain sections was around 1% to 5%.
On the other hand, children spent money was big than others, top on the music at 39%, and least on the food by 10%. remain sectors was above highest proportion. However, boys and girls were similar trends followed highest on the music 38% and 40%, although lowest in food and electronic sectors by 9% and 5%, while remain sectors was above 20% all sectors.
The amount of earning younger and teenager expended on 4 different but common household items in the United Kingdom in 1998.
Overall,The data clearly indicates female invest a large amount on food,While ,teen doys spent lowest amount,However, Children used money on music was similar to woman spent on food.
Regarding to, Adults spent most on food at 25% but they spent only 1% in videos,Meanwhile, they used on eletronic equiment and music a same ratio at 5%. male invest a large proportion on food at 14%,Althought, they used only 2% on videos and 5% on music,they used money on electronic equiment about 10%.Woman waste money on food at 39% ,Whereas,yhey only used 1% and 0.5% on electronic equiment and videos ( Respectively) lastly, they expended 5% on music which is similar to above 3.
In term of, Children waste money on music was the highest amount among the catagories at 39% . They spent most all three on electronic equipment they spend 23% ,Moreover,they spend 10% on food and 12% on videos.Boys invest a big amount on music and the lowest amount on food. Lastly girls spend 40% on music and 5% on electronic equipment.
The given table chart illustrates the portion of five different human categories expenditure on four items namely food, electronic equipment, music, and videos in the UK in the year 1998.
Overall, the highest ratio on food was spent by women while boys showed least interest. Moreover, on music, three groups of people’s expenditure was similar. However, girls showed their highest interest in music.
In terms of food, women expenditure was in the peak, at 39%, followed by adults group which was exact 9% lower than that of women. However, boys were least interested tp spent on food(11%). what’ more, children was most attached with electronic equipment ,ratio was 23%. likewise, expenditure of adults and girls were same at 5% on this category.
on the Other hand, music, which was most preferred by girls ,at 40%,followed by children and boys, 39% and 38% respectively. Ratio for the remaining groups were unfamiliar which was 5%. In terms of videos, boys and girls were almost same about 18%. ratio for the first 3 groups were at 0.5-2 percent.
The table illustrates amount of salary adults and children spent on four similar items in the Great Britain at the year of 1998.
Overall, in music girls spent the highest amount also it was shown a similar trend among children and boys respectivly. Whereas women shown lowest interest in vides. Mean while adults shown a nearly amount of spent femiliar to women.
In the terms of income women spent in food highest which was about 39%. also at the same time women showed a lowest interest in videos at 0.5% also followed by adults and men at 1% and 2% respectivly.
On the other hand, children were more interested in music by 39% followed
The table chart illustrates the ratio of income teenager and children spent on 4 items in UK in the year 1998.
Overall, children more likely to expent on electronic equipment , whereas , in video was the lowest ratio . However, the expenditure of food , women has the highest ratio.
In term of the portion food, women led with the highest ratio at 39%, while adults has the second highest ratio at 25%. Electronic equipment , children spent highest ratio at 23% , followed by boys at 18%. However men has the 10% ratio on electronic equipment , followed by adults and girls at 5% .
Regarding to music proportion children and boys were the similar ratio39% and 38% .
The table chart the distribution of earn money adult and children spend on four different cetegory in the uk.
Overall, the highest number of proportion spend on food by women. women are lowest spend on video. music were highest incoming sector then other remaining sectors.
in terms of adult were highest on food(25%) and lowest on the videos(1%). electronic equipment and music are similar on 5%.in men were highest on food(14%) and lowest on the videos(2%). electronic equipment on 10% and music on 5%. By women, women top on the food and least on the video in 39% and 0.5%. Whereas remain sections was around 1% to 5%.
On the other hand, Children big money spend then other, top on the 39% and lowest are food on 10%. remain sector was higher proportion. in boys were highest spent money on music(38%) and least on food on 9% . in girl were top on music on 40% and lowest on
The table compares the portion of income sours for younger and children spent on four common things- food, electronic equipment, music, and videos in the UK i the year 1998.
Overall, spent much money for food of women otherwise less money spent of boys. Moreover, in electronic equipment spent much money to children, whereas the girls spent money for music, however, every items spent less money for videos.
The men and women was a significant amount spent on food the percentage of 14% and 39%. Thought the adults spent of food in 25%. However,
The table illustrates of the percentage of earned money adults and children spent on food, electronic equipment, music, and videos in the UK in the year 1998.
Overall, the highest number of proportion spent on food by women, while again women was lowest on videos spent. Music were top incoming sectors then others remaining section.
In terms of adults, adults were highest in the food at 25%, and lowest on the videos just 1%. electronic equipment and music similar trend followed by 5%. In men, food was the highest proportion at 14%, while remaining all sectors were above 10%. By women, women top on the food and least on the videos in 39% and 0.5%, whereas remain sections was around 1% to 5%.
On the other hand, children spent money was big than others, top on the music at 39%, and least on the food by 10%. remain sectors was above highest proportion. However, boys and girls were similar trends followed highest on the music 38% and 40%, although lowest in food and electronic sectors by 9% and 5%, while remain sectors was above 20% all sectors.
Sentence making, capitalizations, sentence structures, repetation of structures,sentence structures
Band:5.0
The amount of earning younger and teenager expended on 4 different but common household items in the United Kingdom in 1998.
Overall,The data clearly indicates female invest a large amount on food,While ,teen doys spent lowest amount,However, Children used money on music was similar to woman spent on food.
Regarding to, Adults spent most on food at 25% but they spent only 1% in videos,Meanwhile, they used on eletronic equiment and music a same ratio at 5%. male invest a large proportion on food at 14%,Althought, they used only 2% on videos and 5% on music,they used money on electronic equiment about 10%.Woman waste money on food at 39% ,Whereas,yhey only used 1% and 0.5% on electronic equiment and videos ( Respectively) lastly, they expended 5% on music which is similar to above 3.
In term of, Children waste money on music was the highest amount among the catagories at 39% . They spent most all three on electronic equipment they spend 23% ,Moreover,they spend 10% on food and 12% on videos.Boys invest a big amount on music and the lowest amount on food. Lastly girls spend 40% on music and 5% on electronic equipment.
Sentence making, unnecessary capitalizations, spelling, sentence structures, sentence verb agreement,
Band:5.0
The given table chart illustrates the portion of five different human categories expenditure on four items namely food, electronic equipment, music, and videos in the UK in the year 1998.
Overall, the highest ratio on food was spent by women while boys showed least interest. Moreover, on music, three groups of people’s expenditure was similar. However, girls showed their highest interest in music.
In terms of food, women expenditure was in the peak, at 39%, followed by adults group which was exact 9% lower than that of women. However, boys were least interested tp spent on food(11%). what’ more, children was most attached with electronic equipment ,ratio was 23%. likewise, expenditure of adults and girls were same at 5% on this category.
on the Other hand, music, which was most preferred by girls ,at 40%,followed by children and boys, 39% and 38% respectively. Ratio for the remaining groups were unfamiliar which was 5%. In terms of videos, boys and girls were almost same about 18%. ratio for the first 3 groups were at 0.5-2 percent.
Punctuation, sentence structures, sentence making, preposition, spelling,
Band :5.5
The table illustrates amount of salary adults and children spent on four similar items in the Great Britain at the year of 1998.
Overall, in music girls spent the highest amount also it was shown a similar trend among children and boys respectivly. Whereas women shown lowest interest in vides. Mean while adults shown a nearly amount of spent femiliar to women.
In the terms of income women spent in food highest which was about 39%. also at the same time women showed a lowest interest in videos at 0.5% also followed by adults and men at 1% and 2% respectivly.
On the other hand, children were more interested in music by 39% followed
Preposition, spelling,capitalizations, sentence making, incomplete
Band:4.5
The table chart illustrates the ratio of income teenager and children spent on 4 items in UK in the year 1998.
Overall, children more likely to expent on electronic equipment , whereas , in video was the lowest ratio . However, the expenditure of food , women has the highest ratio.
In term of the portion food, women led with the highest ratio at 39%, while adults has the second highest ratio at 25%. Electronic equipment , children spent highest ratio at 23% , followed by boys at 18%. However men has the 10% ratio on electronic equipment , followed by adults and girls at 5% .
Regarding to music proportion children and boys were the similar ratio39% and 38% .
Sentence making, tense,sentence verb agreement, incomplete
Band:4.0
The table chart the distribution of earn money adult and children spend on four different cetegory in the uk.
Overall, the highest number of proportion spend on food by women. women are lowest spend on video. music were highest incoming sector then other remaining sectors.
in terms of adult were highest on food(25%) and lowest on the videos(1%). electronic equipment and music are similar on 5%.in men were highest on food(14%) and lowest on the videos(2%). electronic equipment on 10% and music on 5%. By women, women top on the food and least on the video in 39% and 0.5%. Whereas remain sections was around 1% to 5%.
On the other hand, Children big money spend then other, top on the 39% and lowest are food on 10%. remain sector was higher proportion. in boys were highest spent money on music(38%) and least on food on 9% . in girl were top on music on 40% and lowest on
Sentence making, capitalizations, sentence structures, repetation,
Band:4.5
The table compares the portion of income sours for younger and children spent on four common things- food, electronic equipment, music, and videos in the UK i the year 1998.
Overall, spent much money for food of women otherwise less money spent of boys. Moreover, in electronic equipment spent much money to children, whereas the girls spent money for music, however, every items spent less money for videos.
The men and women was a significant amount spent on food the percentage of 14% and 39%. Thought the adults spent of food in 25%. However,
Spelling,sentence making,sentence structures,incomplete
Band:3.5