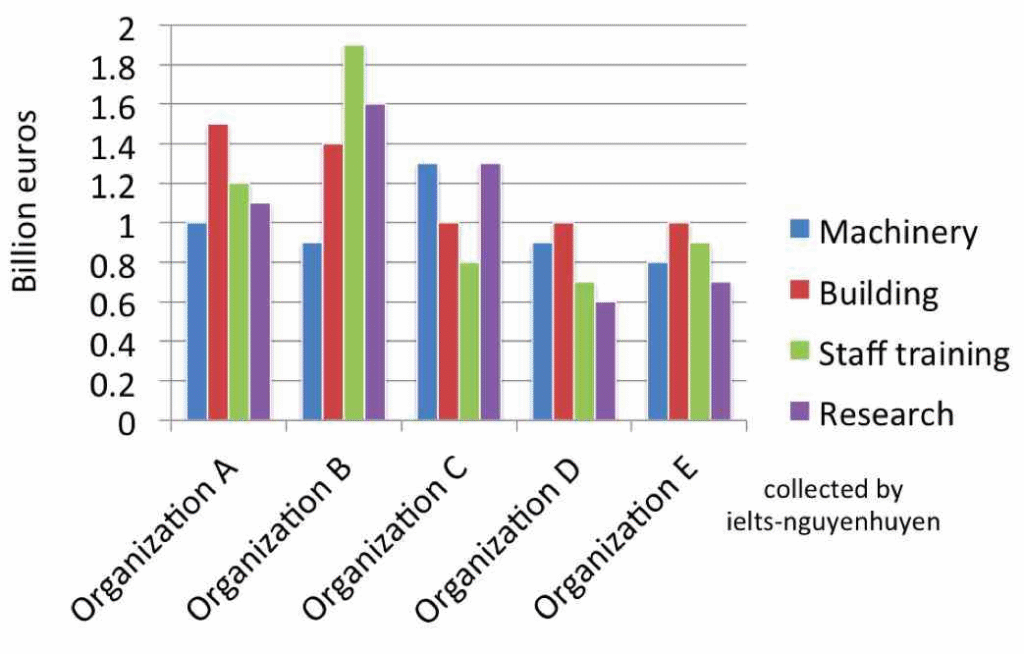
The chart below gives information about billions of euros invested in four areas by various organisations.
Word Count: 0
Submitting...
18 thoughts on “RICU WT 1”
RATUL BOKSH
The bar chat illustrates how billions of euros invested on four distinct areas by different organizations .
Overall , staff training is highest invested area by organization B . in contrast, research is least invested by organization D. On organization A there is major differences between buildings and machinery.
in terms of expend of A’s organization, building is in the highest position ,around 1.5 billion euros. likewise, invest on staff training and research is quite similar, nearly 1.2 billion euros . however, lowest portion of money is spent on machinery which is 1 billion euros. then, organization B ,spent their most amount of euros on staff training which is around 2 billion euros . meanwhile, their least amount of money spent on machinery ,about 0.9 billion. rest of the area expense is si
The bar chart showed information about billions of euros invested in four different region by various organizations.
Overall, in Organization B staff training showed higher trend where machinery followed lower trend. whoever in organization d the research showed downfall reather then others.
The bar graph illustrates data about billions of money expended in four different areas by various kind of organizations.
Overall,The data clearly indicates a mix trend.The staff training was highest from organization B ,While organization E is lowest among them,However, organization D and organization E had a similar ratio on buildings.
Initially, organization A was highest in building around 1.4 billion and the machinery they spent only 1 billions.Meanwhile, in staff training and research they expended below 1.2 and 1.1 billion(respectively) .Organization B invest almost 1.8 billion on staff training they used least propotion on machinery and around 1.4 in building and research they spend below 1.6 billions.The organization D they invest on machinery and research in a similar ratio about 1.2
The bar chart shows the information about billions of euros invested among four areas by different organizations .The units are measured in
euros.
overall, organization b was the highest portions in staff training whereas ,organization d was lowest invest in staff training . the building was the second highest portions by organization a.
In machinery organization b was invest around 0.9 euros and 1.4 euros are invest in building whereas, 1billions euros invest in machinery and 1.4 invest in building by organization a. reserch was the lowest
The bar chart illustrates the euros invested four different types of areas- Machinery, Building, Staff training, and Research providing by different organizations .
Overall, all of organizations were more spent on Machinery and Building, whereas less invested was seen in the Research. Notably, a mej difference was noticed in the expense ratio on Staff training by the oeganization B.
The bar chart compares how billions of euros invested on Machinery, Building, Staff training, and Research types of location in different organization.
Overall, Staff training were highest number of euros invested in organization b, while Research was the lowest invest on organization d. The Building was the maintain on invest same away on other sector.
In terms of Machinery, the Machinery highest on organization c around 1.3, although lowest on e(0.8). on the other sector maintain the about under 1 billions euros. By contrast, Buildings highest in organization a at around 1.6, by followed in second highest in just above 1.4. and similar trend followed remain sector similar 1 euros.
The bar chart illustrates the data about billions of euros spent in four different areas by organisations.
Overall, the organigation B was the highest number of euros spended by staff training , whearease less proneness seen in research . Notably in organization D there were similar amount invested by matchinery and research.
In term of organization B, staff training were spent highest euros , just above 1.8 billion , followed by research and building between 1.64. and 1.6 , less proneness expence in machinery around 1 billion euros . However , organization A Building more likely to spent on
The bar chart illustrates investment in different sectors from four areas.
Overall, while building was given the highest amount o money from organization A,D and E, staff training was the field that organization B focused their money. Organization C was equal for machine and research.
Regarding the investment in building, this sector the highest from organization A. 1.5 billion euros was invested. this is closely followed for the money by organization B (1.4 billion euros). the data for the amount of money invested in staff training by organization B a led with around 1.9 billion euros. The figure for the other organizations, which ranged from about 0.7 billion to 1.2 billion.
The bar chart compares the information billions of euros spent in four areas different organisations.
Overall,the organisations of staff training highest and lest billion in machinery.furthermore,research and staff traning semilar.
In terms of Organization A,building highest billion euros nearly 1.6 and lowest 1 bollion euros.however,staff tranning and research similar about 1.1 and 1.2 respectively.moreover,staff traning highest almost 1.8 billions euros followed by research 1.6.likewise
The bar chat illustrates how billions of euros invested on four distinct areas by different organizations .
Overall , staff training is highest invested area by organization B . in contrast, research is least invested by organization D. On organization A there is major differences between buildings and machinery.
in terms of expend of A’s organization, building is in the highest position ,around 1.5 billion euros. likewise, invest on staff training and research is quite similar, nearly 1.2 billion euros . however, lowest portion of money is spent on machinery which is 1 billion euros. then, organization B ,spent their most amount of euros on staff training which is around 2 billion euros . meanwhile, their least amount of money spent on machinery ,about 0.9 billion. rest of the area expense is si
Article,capitalization, word selection, sentence structures, incomplete
Band: 4:0
The bar chart showed information about billions of euros invested in four different region by various organizations.
Overall, in Organization B staff training showed higher trend where machinery followed lower trend. whoever in organization d the research showed downfall reather then others.
On the one hand, organization a buldinf
Sentence verb agreement, spelling, sentence making, incomplete
Band: 3:0
The bar graph illustrates data about billions of money expended in four different areas by various kind of organizations.
Overall,The data clearly indicates a mix trend.The staff training was highest from organization B ,While organization E is lowest among them,However, organization D and organization E had a similar ratio on buildings.
Initially, organization A was highest in building around 1.4 billion and the machinery they spent only 1 billions.Meanwhile, in staff training and research they expended below 1.2 and 1.1 billion(respectively) .Organization B invest almost 1.8 billion on staff training they used least propotion on machinery and around 1.4 in building and research they spend below 1.6 billions.The organization D they invest on machinery and research in a similar ratio about 1.2
Article, paragraphing, sentence structures, sentence organizations
Band: 4:0
The bar chart shows the information about billions of euros invested among four areas by different organizations .The units are measured in
euros.
overall, organization b was the highest portions in staff training whereas ,organization d was lowest invest in staff training . the building was the second highest portions by organization a.
In machinery organization b was invest around 0.9 euros and 1.4 euros are invest in building whereas, 1billions euros invest in machinery and 1.4 invest in building by organization a. reserch was the lowest
Tense,capitalization, poor overview organisations, sentence making, incomplete
Band:3.5
The bar chart illustrates the euros invested four different types of areas- Machinery, Building, Staff training, and Research providing by different organizations .
Overall, all of organizations were more spent on Machinery and Building, whereas less invested was seen in the Research. Notably, a mej difference was noticed in the expense ratio on Staff training by the oeganization B.
In terms of the expenditure on
Preposition, spelling, sentence making, incomplete
Band: 2.5
The bar chart compares how billions of euros invested on Machinery, Building, Staff training, and Research types of location in different organization.
Overall, Staff training were highest number of euros invested in organization b, while Research was the lowest invest on organization d. The Building was the maintain on invest same away on other sector.
In terms of Machinery, the Machinery highest on organization c around 1.3, although lowest on e(0.8). on the other sector maintain the about under 1 billions euros. By contrast, Buildings highest in organization a at around 1.6, by followed in second highest in just above 1.4. and similar trend followed remain sector similar 1 euros.
regarding to Staff training , the m
Sentence verb agreement, article, sentence making, capitalization, unnecessary capitalizations, incomplete
Band: 4:0
The bar chart illustrates the data about billions of euros spent in four different areas by organisations.
Overall, the organigation B was the highest number of euros spended by staff training , whearease less proneness seen in research . Notably in organization D there were similar amount invested by matchinery and research.
In term of organization B, staff training were spent highest euros , just above 1.8 billion , followed by research and building between 1.64. and 1.6 , less proneness expence in machinery around 1 billion euros . However , organization A Building more likely to spent on
Spelling, sentence verb agreement, sentence structures, incomplete
Band:4. 5
The bar chart illustrates investment in different sectors from four areas.
Overall, while building was given the highest amount o money from organization A,D and E, staff training was the field that organization B focused their money. Organization C was equal for machine and research.
Regarding the investment in building, this sector the highest from organization A. 1.5 billion euros was invested. this is closely followed for the money by organization B (1.4 billion euros). the data for the amount of money invested in staff training by organization B a led with around 1.9 billion euros. The figure for the other organizations, which ranged from about 0.7 billion to 1.2 billion.
By comparison,
Sentence making, incomplete, poor overview
Band:3:0
The bar chart compares the information billions of euros spent in four areas different organisations.
Overall,the organisations of staff training highest and lest billion in machinery.furthermore,research and staff traning semilar.
In terms of Organization A,building highest billion euros nearly 1.6 and lowest 1 bollion euros.however,staff tranning and research similar about 1.1 and 1.2 respectively.moreover,staff traning highest almost 1.8 billions euros followed by research 1.6.likewise
Preposition, spelling, capitalizations,sentence structures, incomplete
Band:3.0