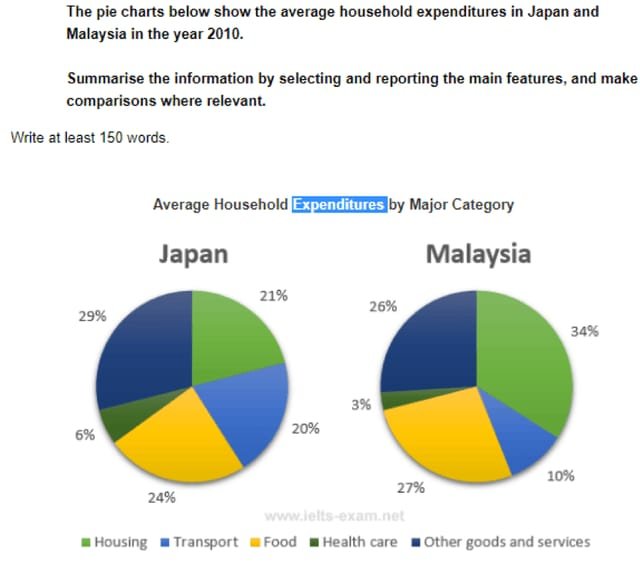
The pic charts illustrates the average household expenditures in japan and malaysia in 2010.divided into five categories: housing, transport, food, health care, other goods and services.
Overall, housing accounted for the largest portion of spending in malaysia. While japanese households spend the most on other good and services. Health care represented the smallest expenditure in both countries.
In malaysia, 34% of household spending went to housing, compared to 21% in japan. Food was the secound largest categories in both countries, comprising 24% in malaysia and 27% in japan.
The most sighnificent portion of japanese spending was on other goods and services at 29%. Transport accounted for 20% of spending in japanand 10% in malaysia. The both countries spend the largest on health care, comprising 6% in japan and 3% in malaysia.
The pie charts compare how the average household expended in five distinct sectors in Japan and Malaysia in 2010.
Overall, Malaysia expended their highest in housing ,in contrast, Japan’s highest expense was in other goods and services. Meanwhile, both countries showed least interest in health care sector.
In terms of Japan, their highest expense was in other good and services, at 29%. Moreover, food followed the other good and services and stood in second position at 24%. Likewise, percentages for housing and transportation were quite similar,21% and 20% respectively. At last, Japan’s lowest expense was in health care sector.
On the other hand, Malaysia, their highest expenditure was in housing, at 34%. then, percentages for food and other good and services were almost same , 27% and 26% respectively. what’s more, in transportation, Malaysia’s expense was 10%. however, only 3% expense was in healthcare and it was lowest sector for Malaysia.
The two pie charts compare how the average household expended in five different sectors in Japan and Malaysia in 2010.
Overall, Japan and Malaysia both were highest in the food and housing, while both also lowest in the health care sectors. Other goods and services were similar trend provides two countries.
In terms of Japan, their highest expense was in other goods and services (29%), that followed by food at 24%. Moreover, housing and transport were provides similar trend at 21% and 20%, whereas lowest expense on household in health care just 6%.
in Malaysia, the expense of household in Malaysia was top on the housing at 34%, and second top in the food was 27%. In contrast, other goods and services expenses in this sectors was the 26%, how ever, transport was the second lowest sectors in this country at above 10%. the lowest expended section in only both country was health care just 3% in Malaysia. there was a provides similar trend on both countries
The pie charts illustrate the average household income sours five different category- Housing, Transport, Food, Health care, and other goods and services in Japan and Malaysia in the year of 2010.
Overall, household was expenditure in the Japan more expend of other goods and services, however, in Malaysia this category also decreased. The category of Health care, food, and transportation in Japan
The pie charts compare to information between Japan and Malaysia the average household expenditure in 2010.the units are measured in percentage.
Overall, housing was the highest portion in Malaysia and other goods and services was most popular in Japan whereas, health care were the lowest portion between Japan and Malaysia.
Other goods and services was the highest portion which is 29.Japan people’s spent 24% money in food .In Transport and housing the people spent 20% and 21% respectively. Only 6% expenditure in health care
Housing was the big portion in Malaysia which is 34%.
The pie charts compare the average household expenditures in two different nation at 2010.
Overall, housing were more likely to expend in Malaysia, which was also more favoured to Japan. Moreover, the percentage of transport was the highest while an opposite trend can be seen regarding the proportion of japan.
In terms of the ratio of expenditure in housing both malaysia and japan had the highest percentage at 34% and 21% respectivly. In food both country was in second hight which was sim
The pie charts illustrate the average spending in household product from to different country japan and malaysia in the year of 2010.
Overall, Malaysia expended large amount in housing, while, japan invest highest amount in other goods and services,However,both country spent a handsome amount in transport. Although, a major different seen in the time of housing between japan and malaysia.
In term of, japan they used highest aamount in other goods and services at 29% ,while they spend only 6% in health care.For transport they used 20% ,Meanwhile,in term of food they expended only 20% and for housing they spend 21% which is second highest invesing product in japan.
Malaysia used a largest porption in housing and other goods and services 34% and 26% ( Respectively). Meanwhile,they spend a small amount in health care only 3% .While they spend 27% on food and 10% on transport. IN term of lowest invest is health care whice is 2 time more in japan .
The pie charts illustrate the total household expenditures in two different nations -Japan and Malaysia in the yea
Overall , the ratio of housing more likely to spent by Malaysia , while less proneness seen in health care in Malaysia . However, other goods and services that were almost similar ratio in both country.
In term of housing, Malaysia led with the highest proportion at 34%, whereas,Japan spent AT 21%.Moreover, Japan and Malaysia both spent almost similar ratio in other goods and services at 29% and 26%. Meanwhile, Malaysia more likely to spent in food at 27% and least spent by Japan at 24% .
Regarding to transportation ,Japan was the highest portion at 20 % and Malaysia was the least at 10%. Healthcare were the less proneness seen by both country betwee
The pic charts illustrates the average household expenditures in japan and malaysia in 2010.divided into five categories: housing, transport, food, health care, other goods and services.
Overall, housing accounted for the largest portion of spending in malaysia. While japanese households spend the most on other good and services. Health care represented the smallest expenditure in both countries.
In malaysia, 34% of household spending went to housing, compared to 21% in japan. Food was the secound largest categories in both countries, comprising 24% in malaysia and 27% in japan.
The most sighnificent portion of japanese spending was on other goods and services at 29%. Transport accounted for 20% of spending in japanand 10% in malaysia. The both countries spend the largest on health care, comprising 6% in japan and 3% in malaysia.
Sentence verb agreement, spelling, sentence structures
Band:5.5
The pie charts compare how the average household expended in five distinct sectors in Japan and Malaysia in 2010.
Overall, Malaysia expended their highest in housing ,in contrast, Japan’s highest expense was in other goods and services. Meanwhile, both countries showed least interest in health care sector.
In terms of Japan, their highest expense was in other good and services, at 29%. Moreover, food followed the other good and services and stood in second position at 24%. Likewise, percentages for housing and transportation were quite similar,21% and 20% respectively. At last, Japan’s lowest expense was in health care sector.
On the other hand, Malaysia, their highest expenditure was in housing, at 34%. then, percentages for food and other good and services were almost same , 27% and 26% respectively. what’s more, in transportation, Malaysia’s expense was 10%. however, only 3% expense was in healthcare and it was lowest sector for Malaysia.
Capitalization, article,word selection, structure repetation
Band:5.5
The two pie charts compare how the average household expended in five different sectors in Japan and Malaysia in 2010.
Overall, Japan and Malaysia both were highest in the food and housing, while both also lowest in the health care sectors. Other goods and services were similar trend provides two countries.
In terms of Japan, their highest expense was in other goods and services (29%), that followed by food at 24%. Moreover, housing and transport were provides similar trend at 21% and 20%, whereas lowest expense on household in health care just 6%.
in Malaysia, the expense of household in Malaysia was top on the housing at 34%, and second top in the food was 27%. In contrast, other goods and services expenses in this sectors was the 26%, how ever, transport was the second lowest sectors in this country at above 10%. the lowest expended section in only both country was health care just 3% in Malaysia. there was a provides similar trend on both countries
Article,sentence making,sentence structure,capitalization,
Band:5.0
The pie charts illustrate the average household income sours five different category- Housing, Transport, Food, Health care, and other goods and services in Japan and Malaysia in the year of 2010.
Overall, household was expenditure in the Japan more expend of other goods and services, however, in Malaysia this category also decreased. The category of Health care, food, and transportation in Japan
Spelling, sentence making, incomplete
Band:3.0
The pie charts compare to information between Japan and Malaysia the average household expenditure in 2010.the units are measured in percentage.
Overall, housing was the highest portion in Malaysia and other goods and services was most popular in Japan whereas, health care were the lowest portion between Japan and Malaysia.
Other goods and services was the highest portion which is 29.Japan people’s spent 24% money in food .In Transport and housing the people spent 20% and 21% respectively. Only 6% expenditure in health care
Housing was the big portion in Malaysia which is 34%.
Capitalization,sentence making,tense,sentence structure, incomplete
Band:4.0
The pie charts compare the average household expenditures in two different nation at 2010.
Overall, housing were more likely to expend in Malaysia, which was also more favoured to Japan. Moreover, the percentage of transport was the highest while an opposite trend can be seen regarding the proportion of japan.
In terms of the ratio of expenditure in housing both malaysia and japan had the highest percentage at 34% and 21% respectivly. In food both country was in second hight which was sim
Sentence verb agreement, spelling,sentence structure, incomplete
Band: 4.0
Sentence verb agreement, sentence structures, incomplete
Band:4.0
The pie charts illustrate the average spending in household product from to different country japan and malaysia in the year of 2010.
Overall, Malaysia expended large amount in housing, while, japan invest highest amount in other goods and services,However,both country spent a handsome amount in transport. Although, a major different seen in the time of housing between japan and malaysia.
In term of, japan they used highest aamount in other goods and services at 29% ,while they spend only 6% in health care.For transport they used 20% ,Meanwhile,in term of food they expended only 20% and for housing they spend 21% which is second highest invesing product in japan.
Malaysia used a largest porption in housing and other goods and services 34% and 26% ( Respectively). Meanwhile,they spend a small amount in health care only 3% .While they spend 27% on food and 10% on transport. IN term of lowest invest is health care whice is 2 time more in japan .
Capitalization,word selection, sentence verb agreement, punctuation, spelling,
Band: 5.0
The pie charts illustrate the total household expenditures in two different nations -Japan and Malaysia in the yea
Overall , the ratio of housing more likely to spent by Malaysia , while less proneness seen in health care in Malaysia . However, other goods and services that were almost similar ratio in both country.
In term of housing, Malaysia led with the highest proportion at 34%, whereas,Japan spent AT 21%.Moreover, Japan and Malaysia both spent almost similar ratio in other goods and services at 29% and 26%. Meanwhile, Malaysia more likely to spent in food at 27% and least spent by Japan at 24% .
Regarding to transportation ,Japan was the highest portion at 20 % and Malaysia was the least at 10%. Healthcare were the less proneness seen by both country betwee
Spelling,sentence structure, sentence verb agreement, unnecessary capitalization,incomplete
Band:5.5